Immigrants from Egypt vs Cambodian College, 1 year or more

COMPARE

Immigrants from Egypt
Race
Ancestry
AfghanAfricanAlaska NativeAlaskan AthabascanAlbanianAleutAlsatianAmericanApacheArabArapahoArgentineanArmenianAssyrian/Chaldean/SyriacAustralianAustrianBahamianBangladeshiBarbadianBasqueBelgianBelizeanBermudanBhutaneseBlackfeetBolivianBrazilianBritishBritish West IndianBulgarianBurmeseCajunCanadianCape VerdeanCarpatho RusynCelticCentral AmericanCentral American IndianCherokeeCheyenneChickasawChileanChineseChippewaChoctawColombianColvilleComancheCosta RicanCreeCreekCroatianCrowCubanCypriotCzechCzechoslovakianDanishDelawareDominicanDutchDutch West IndianEastern EuropeanEcuadorianEgyptianEnglishEstonianEthiopianEuropeanFijianFilipinoFinnishFrenchFrench American IndianFrench CanadianGermanGerman RussianGhanaianGreekGuamanian/ChamorroGuatemalanGuyaneseHaitianHmongHonduranHopiHoumaHungarianIcelanderIndian (Asian)IndonesianInupiatIranianIraqiIrishIroquoisIsraeliItalianJamaicanJapaneseJordanianKenyanKiowaKoreanLaotianLatvianLebaneseLiberianLithuanianLumbeeLuxembourgerMacedonianMalaysianMalteseMarshalleseMenomineeMexicanMexican American IndianMongolianMoroccanNative HawaiianNavajoNepaleseNew ZealanderNicaraguanNigerianNorthern EuropeanNorwegianOkinawanOsageOttawaPaiutePakistaniPalestinianPanamanianParaguayanPennsylvania GermanPeruvianPimaPolishPortuguesePotawatomiPuebloPuerto RicanPuget Sound SalishRomanianRussianSalvadoranSamoanScandinavianScotch-IrishScottishSeminoleSenegaleseSerbianShoshoneSierra LeoneanSiouxSlavicSlovakSloveneSomaliSouth AfricanSouth AmericanSouth American IndianSoviet UnionSpaniardSpanishSpanish AmericanSpanish American IndianSri LankanSubsaharan AfricanSudaneseSwedishSwissSyrianTaiwaneseThaiTlingit-HaidaTohono O'OdhamTonganTrinidadian and TobagonianTsimshianTurkishU.S. Virgin IslanderUgandanUkrainianUruguayanUteVenezuelanVietnameseWelshWest IndianYakamaYaquiYugoslavianYumanYup'ikZimbabwean
Immigration
NonimmigrantsImmigrantsAfghanistanAfricaAlbaniaArgentinaArmeniaAsiaAustraliaAustriaBahamasBangladeshBarbadosBelarusBelgiumBelizeBoliviaBosnia and HerzegovinaBrazilBulgariaBurma/MyanmarCabo VerdeCambodiaCameroonCanadaCaribbeanCentral AmericaChileChinaColombiaCongoCosta RicaCroatiaCubaCzechoslovakiaDenmarkDominicaDominican RepublicEastern AfricaEastern AsiaEastern EuropeEcuadorEgyptEl SalvadorEnglandEritreaEthiopiaEuropeFijiFranceGermanyGhanaGreeceGrenadaGuatemalaGuyanaHaitiHondurasHong KongHungaryIndiaIndonesiaIranIraqIrelandIsraelItalyJamaicaJapanJordanKazakhstanKenyaKoreaKuwaitLaosLatin AmericaLatviaLebanonLiberiaLithuaniaMalaysiaMexicoMicronesiaMiddle AfricaMoldovaMoroccoNepalNetherlandsNicaraguaNigeriaNorth AmericaNorth MacedoniaNorthern AfricaNorthern EuropeNorwayOceaniaPakistanPanamaPeruPhilippinesPolandPortugalRomaniaRussiaSaudi ArabiaScotlandSenegalSerbiaSierra LeoneSingaporeSomaliaSouth AfricaSouth AmericaSouth Central AsiaSouth Eastern AsiaSouthern EuropeSpainSri LankaSt. Vincent and the GrenadinesSudanSwedenSwitzerlandSyriaTaiwanThailandTrinidad and TobagoTurkeyUgandaUkraineUruguayUzbekistanVenezuelaVietnamWest IndiesWestern AfricaWestern AsiaWestern EuropeYemenZaireZimbabweAzores
Cambodian
Race
Ancestry
AfghanAfricanAlaska NativeAlaskan AthabascanAlbanianAleutAlsatianAmericanApacheArabArapahoArgentineanArmenianAssyrian/Chaldean/SyriacAustralianAustrianBahamianBangladeshiBarbadianBasqueBelgianBelizeanBermudanBhutaneseBlackfeetBolivianBrazilianBritishBritish West IndianBulgarianBurmeseCajunCambodianCanadianCape VerdeanCarpatho RusynCelticCentral AmericanCentral American IndianCherokeeCheyenneChickasawChileanChineseChippewaChoctawColombianColvilleComancheCosta RicanCreeCreekCroatianCrowCubanCypriotCzechCzechoslovakianDanishDelawareDominicanDutchDutch West IndianEastern EuropeanEcuadorianEgyptianEnglishEstonianEthiopianEuropeanFijianFilipinoFinnishFrenchFrench American IndianFrench CanadianGermanGerman RussianGhanaianGreekGuamanian/ChamorroGuatemalanGuyaneseHaitianHmongHonduranHopiHoumaHungarianIcelanderIndian (Asian)IndonesianInupiatIranianIraqiIrishIroquoisIsraeliItalianJamaicanJapaneseJordanianKenyanKiowaKoreanLaotianLatvianLebaneseLiberianLithuanianLumbeeLuxembourgerMacedonianMalaysianMalteseMarshalleseMenomineeMexicanMexican American IndianMongolianMoroccanNative HawaiianNavajoNepaleseNew ZealanderNicaraguanNigerianNorthern EuropeanNorwegianOkinawanOsageOttawaPaiutePakistaniPalestinianPanamanianParaguayanPennsylvania GermanPeruvianPimaPolishPortuguesePotawatomiPuebloPuerto RicanPuget Sound SalishRomanianRussianSalvadoranSamoanScandinavianScotch-IrishScottishSeminoleSenegaleseSerbianShoshoneSierra LeoneanSiouxSlavicSlovakSloveneSomaliSouth AfricanSouth AmericanSouth American IndianSoviet UnionSpaniardSpanishSpanish AmericanSpanish American IndianSri LankanSubsaharan AfricanSudaneseSwedishSwissSyrianTaiwaneseThaiTlingit-HaidaTohono O'OdhamTonganTrinidadian and TobagonianTsimshianTurkishU.S. Virgin IslanderUgandanUkrainianUruguayanUteVenezuelanVietnameseWelshWest IndianYakamaYaquiYugoslavianYumanYup'ikZimbabwean
Immigration
NonimmigrantsImmigrantsAfghanistanAfricaAlbaniaArgentinaArmeniaAsiaAustraliaAustriaBahamasBangladeshBarbadosBelarusBelgiumBelizeBoliviaBosnia and HerzegovinaBrazilBulgariaBurma/MyanmarCabo VerdeCambodiaCameroonCanadaCaribbeanCentral AmericaChileChinaColombiaCongoCosta RicaCroatiaCubaCzechoslovakiaDenmarkDominicaDominican RepublicEastern AfricaEastern AsiaEastern EuropeEcuadorEl SalvadorEnglandEritreaEthiopiaEuropeFijiFranceGermanyGhanaGreeceGrenadaGuatemalaGuyanaHaitiHondurasHong KongHungaryIndiaIndonesiaIranIraqIrelandIsraelItalyJamaicaJapanJordanKazakhstanKenyaKoreaKuwaitLaosLatin AmericaLatviaLebanonLiberiaLithuaniaMalaysiaMexicoMicronesiaMiddle AfricaMoldovaMoroccoNepalNetherlandsNicaraguaNigeriaNorth AmericaNorth MacedoniaNorthern AfricaNorthern EuropeNorwayOceaniaPakistanPanamaPeruPhilippinesPolandPortugalRomaniaRussiaSaudi ArabiaScotlandSenegalSerbiaSierra LeoneSingaporeSomaliaSouth AfricaSouth AmericaSouth Central AsiaSouth Eastern AsiaSouthern EuropeSpainSri LankaSt. Vincent and the GrenadinesSudanSwedenSwitzerlandSyriaTaiwanThailandTrinidad and TobagoTurkeyUgandaUkraineUruguayUzbekistanVenezuelaVietnamWest IndiesWestern AfricaWestern AsiaWestern EuropeYemenZaireZimbabweAzores
College, 1 year or more
Income
Poverty
Unemployment
Labor Participation
Family Structure
Vehicle Availability
Education Level
Disability

College, 1 year or more Comparison

Immigrants from Egypt

Cambodians

Exceptional
Exceptional
62.4%
COLLEGE, 1 YEAR OR MORE
97.8/ 100
METRIC RATING
92nd/ 347
METRIC RANK
66.7%
COLLEGE, 1 YEAR OR MORE
100.0/ 100
METRIC RATING
15th/ 347
METRIC RANK

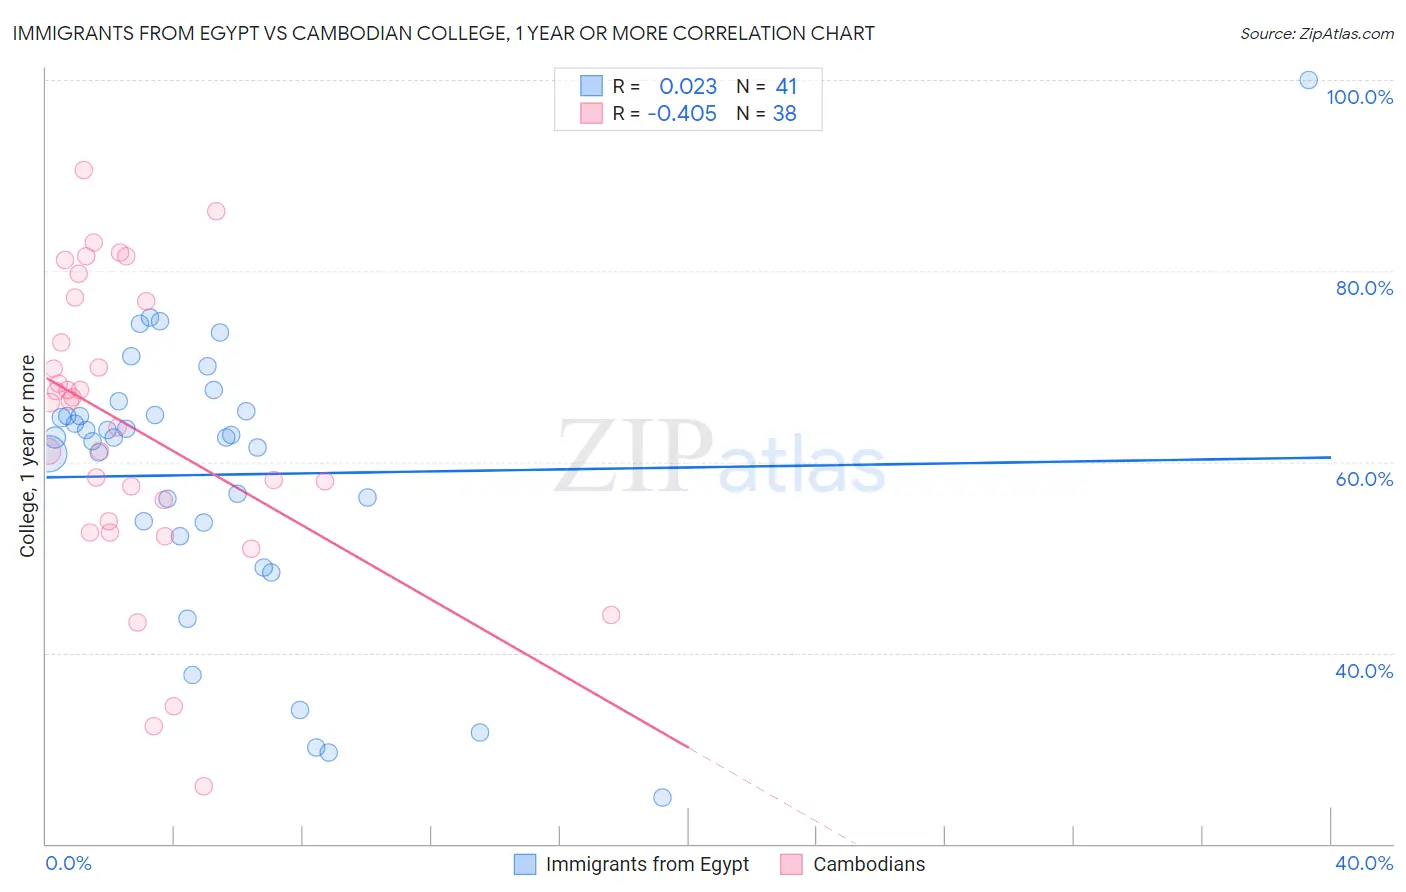
Immigrants from Egypt vs Cambodian College, 1 year or more Correlation Chart

The statistical analysis conducted on geographies consisting of 245,485,794 people shows no correlation between the proportion of Immigrants from Egypt and percentage of population with at least college, 1 year or more education in the United States with a correlation coefficient (R) of 0.023 and weighted average of 62.4%. Similarly, the statistical analysis conducted on geographies consisting of 102,514,976 people shows a moderate negative correlation between the proportion of Cambodians and percentage of population with at least college, 1 year or more education in the United States with a correlation coefficient (R) of -0.405 and weighted average of 66.7%, a difference of 6.9%.
Immigrants from Egypt vs Cambodian College, 1 year or more

College, 1 year or more Correlation Summary

MeasurementImmigrants from EgyptCambodian
Minimum24.8%26.0%
Maximum100.0%90.6%
Range75.2%64.6%
Mean58.7%63.6%
Median62.6%66.3%
Interquartile 25% (IQ1)53.0%53.8%
Interquartile 75% (IQ3)65.1%76.8%
Interquartile Range (IQR)12.1%23.0%
Standard Deviation (Sample)14.7%15.3%
Standard Deviation (Population)14.5%15.1%

Similar Demographics by College, 1 year or more

Demographics Similar to Immigrants from Egypt by College, 1 year or more

In terms of college, 1 year or more, the demographic groups most similar to Immigrants from Egypt are Immigrants from Eastern Europe (62.4%, a difference of 0.010%), Romanian (62.4%, a difference of 0.030%), Immigrants from Croatia (62.3%, a difference of 0.090%), Immigrants from Western Asia (62.5%, a difference of 0.11%), and British (62.3%, a difference of 0.19%).
DemographicsRating | RankCollege, 1 year or more
Immigrants | Pakistan
98.6
/100
|
#85
Exceptional
62.8%
Immigrants | Western Europe
98.6
/100
|
#86
Exceptional
62.7%
Immigrants | Hungary
98.6
/100
|
#87
Exceptional
62.7%
Greeks
98.3
/100
|
#88
Exceptional
62.6%
Immigrants | Ethiopia
98.2
/100
|
#89
Exceptional
62.6%
Immigrants | Western Asia
97.9
/100
|
#90
Exceptional
62.5%
Immigrants | Eastern Europe
97.8
/100
|
#91
Exceptional
62.4%
Immigrants | Egypt
97.8
/100
|
#92
Exceptional
62.4%
Romanians
97.7
/100
|
#93
Exceptional
62.4%
Immigrants | Croatia
97.6
/100
|
#94
Exceptional
62.3%
British
97.4
/100
|
#95
Exceptional
62.3%
Chinese
97.2
/100
|
#96
Exceptional
62.2%
Jordanians
97.2
/100
|
#97
Exceptional
62.2%
Carpatho Rusyns
97.2
/100
|
#98
Exceptional
62.2%
Croatians
97.1
/100
|
#99
Exceptional
62.2%

Demographics Similar to Cambodians by College, 1 year or more

In terms of college, 1 year or more, the demographic groups most similar to Cambodians are Burmese (66.7%, a difference of 0.0%), Immigrants from Japan (66.7%, a difference of 0.030%), Immigrants from Eastern Asia (66.6%, a difference of 0.15%), Immigrants from Sweden (66.8%, a difference of 0.19%), and Eastern European (66.6%, a difference of 0.22%).
DemographicsRating | RankCollege, 1 year or more
Thais
100.0
/100
|
#8
Exceptional
68.6%
Immigrants | Israel
100.0
/100
|
#9
Exceptional
67.8%
Immigrants | Australia
100.0
/100
|
#10
Exceptional
67.7%
Immigrants | South Central Asia
100.0
/100
|
#11
Exceptional
67.1%
Cypriots
100.0
/100
|
#12
Exceptional
67.0%
Immigrants | Sweden
100.0
/100
|
#13
Exceptional
66.8%
Burmese
100.0
/100
|
#14
Exceptional
66.7%
Cambodians
100.0
/100
|
#15
Exceptional
66.7%
Immigrants | Japan
100.0
/100
|
#16
Exceptional
66.7%
Immigrants | Eastern Asia
100.0
/100
|
#17
Exceptional
66.6%
Eastern Europeans
100.0
/100
|
#18
Exceptional
66.6%
Immigrants | Switzerland
100.0
/100
|
#19
Exceptional
66.5%
Immigrants | Korea
100.0
/100
|
#20
Exceptional
66.5%
Immigrants | Hong Kong
100.0
/100
|
#21
Exceptional
66.4%
Soviet Union
100.0
/100
|
#22
Exceptional
66.4%