Immigrants from Egypt vs Immigrants from Kenya College, 1 year or more
COMPARE
Immigrants from Egypt
Immigrants from Kenya
College, 1 year or more
College, 1 year or more Comparison
Immigrants from Egypt
Immigrants from Kenya
62.4%
COLLEGE, 1 YEAR OR MORE
97.8/ 100
METRIC RATING
92nd/ 347
METRIC RANK
60.5%
COLLEGE, 1 YEAR OR MORE
79.1/ 100
METRIC RATING
147th/ 347
METRIC RANK
Immigrants from Egypt vs Immigrants from Kenya College, 1 year or more Correlation Chart
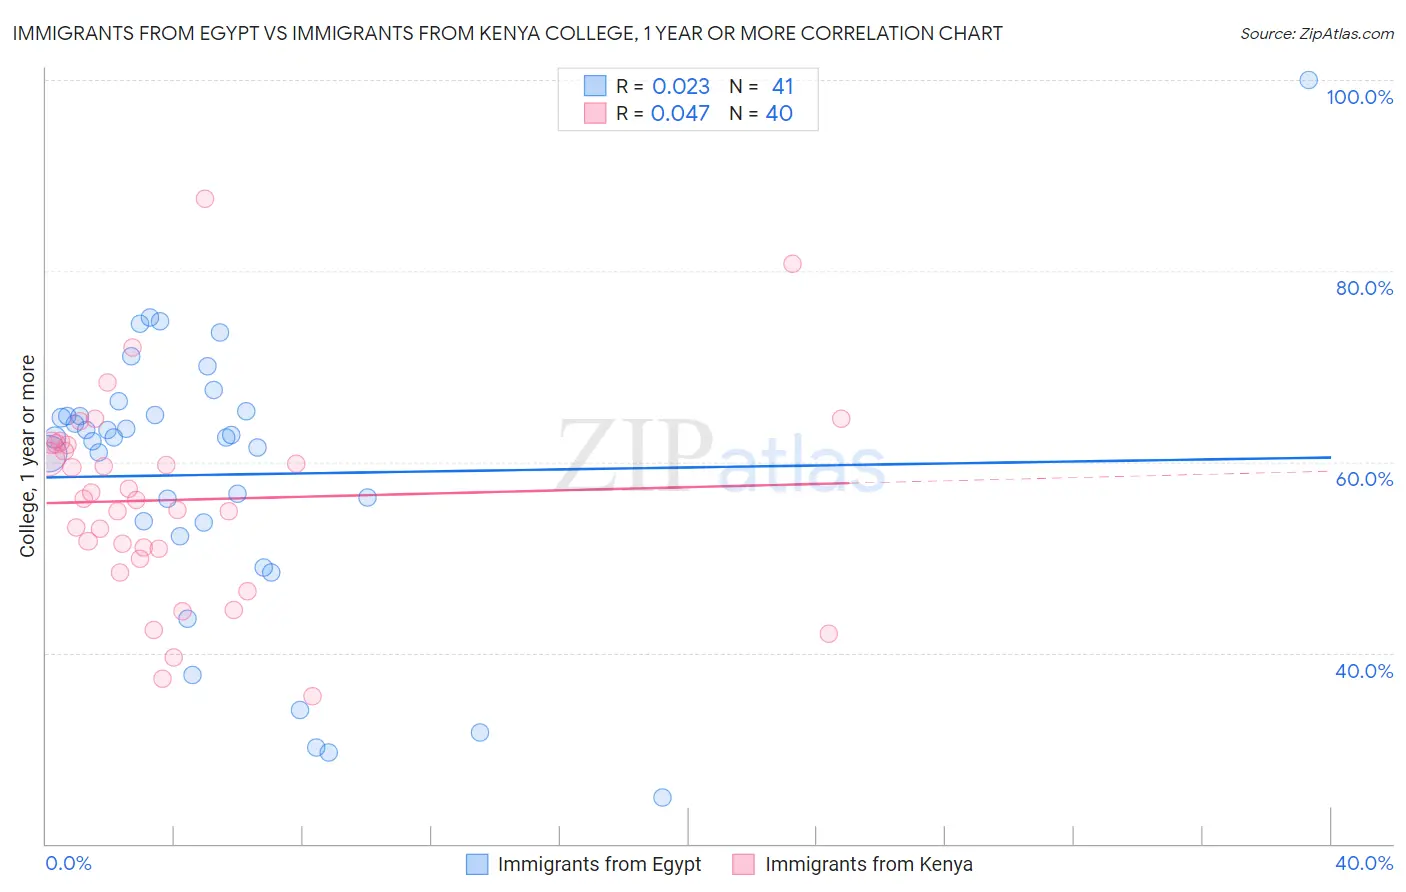
The statistical analysis conducted on geographies consisting of 245,485,794 people shows no correlation between the proportion of Immigrants from Egypt and percentage of population with at least college, 1 year or more education in the United States with a correlation coefficient (R) of 0.023 and weighted average of 62.4%. Similarly, the statistical analysis conducted on geographies consisting of 218,085,582 people shows no correlation between the proportion of Immigrants from Kenya and percentage of population with at least college, 1 year or more education in the United States with a correlation coefficient (R) of 0.047 and weighted average of 60.5%, a difference of 3.2%.
College, 1 year or more Correlation Summary
| Measurement | Immigrants from Egypt | Immigrants from Kenya |
| Minimum | 24.8% | 35.4% |
| Maximum | 100.0% | 87.6% |
| Range | 75.2% | 52.2% |
| Mean | 58.7% | 56.0% |
| Median | 62.6% | 56.0% |
| Interquartile 25% (IQ1) | 53.0% | 50.4% |
| Interquartile 75% (IQ3) | 65.1% | 61.8% |
| Interquartile Range (IQR) | 12.1% | 11.4% |
| Standard Deviation (Sample) | 14.7% | 10.7% |
| Standard Deviation (Population) | 14.5% | 10.6% |
Similar Demographics by College, 1 year or more
Demographics Similar to Immigrants from Egypt by College, 1 year or more
In terms of college, 1 year or more, the demographic groups most similar to Immigrants from Egypt are Immigrants from Eastern Europe (62.4%, a difference of 0.010%), Romanian (62.4%, a difference of 0.030%), Immigrants from Croatia (62.3%, a difference of 0.090%), Immigrants from Western Asia (62.5%, a difference of 0.11%), and British (62.3%, a difference of 0.19%).
| Demographics | Rating | Rank | College, 1 year or more |
| Immigrants | Pakistan | 98.6 /100 | #85 | Exceptional 62.8% |
| Immigrants | Western Europe | 98.6 /100 | #86 | Exceptional 62.7% |
| Immigrants | Hungary | 98.6 /100 | #87 | Exceptional 62.7% |
| Greeks | 98.3 /100 | #88 | Exceptional 62.6% |
| Immigrants | Ethiopia | 98.2 /100 | #89 | Exceptional 62.6% |
| Immigrants | Western Asia | 97.9 /100 | #90 | Exceptional 62.5% |
| Immigrants | Eastern Europe | 97.8 /100 | #91 | Exceptional 62.4% |
| Immigrants | Egypt | 97.8 /100 | #92 | Exceptional 62.4% |
| Romanians | 97.7 /100 | #93 | Exceptional 62.4% |
| Immigrants | Croatia | 97.6 /100 | #94 | Exceptional 62.3% |
| British | 97.4 /100 | #95 | Exceptional 62.3% |
| Chinese | 97.2 /100 | #96 | Exceptional 62.2% |
| Jordanians | 97.2 /100 | #97 | Exceptional 62.2% |
| Carpatho Rusyns | 97.2 /100 | #98 | Exceptional 62.2% |
| Croatians | 97.1 /100 | #99 | Exceptional 62.2% |
Demographics Similar to Immigrants from Kenya by College, 1 year or more
In terms of college, 1 year or more, the demographic groups most similar to Immigrants from Kenya are Kenyan (60.5%, a difference of 0.010%), Brazilian (60.5%, a difference of 0.010%), Scottish (60.5%, a difference of 0.090%), Immigrants from Sudan (60.4%, a difference of 0.10%), and Albanian (60.4%, a difference of 0.10%).
| Demographics | Rating | Rank | College, 1 year or more |
| Iraqis | 83.3 /100 | #140 | Excellent 60.7% |
| Immigrants | Afghanistan | 83.1 /100 | #141 | Excellent 60.7% |
| Poles | 82.8 /100 | #142 | Excellent 60.7% |
| Canadians | 82.7 /100 | #143 | Excellent 60.6% |
| Czechs | 81.9 /100 | #144 | Excellent 60.6% |
| Slavs | 81.1 /100 | #145 | Excellent 60.6% |
| Scottish | 80.2 /100 | #146 | Excellent 60.5% |
| Immigrants | Kenya | 79.1 /100 | #147 | Good 60.5% |
| Kenyans | 79.0 /100 | #148 | Good 60.5% |
| Brazilians | 79.0 /100 | #149 | Good 60.5% |
| Immigrants | Sudan | 77.8 /100 | #150 | Good 60.4% |
| Albanians | 77.8 /100 | #151 | Good 60.4% |
| Immigrants | Germany | 76.1 /100 | #152 | Good 60.3% |
| Sierra Leoneans | 74.1 /100 | #153 | Good 60.2% |
| Sudanese | 73.0 /100 | #154 | Good 60.2% |