Immigrants from Egypt vs Lithuanian College, 1 year or more
COMPARE
Immigrants from Egypt
Lithuanian
College, 1 year or more
College, 1 year or more Comparison
Immigrants from Egypt
Lithuanians
62.4%
COLLEGE, 1 YEAR OR MORE
97.8/ 100
METRIC RATING
92nd/ 347
METRIC RANK
62.9%
COLLEGE, 1 YEAR OR MORE
98.8/ 100
METRIC RATING
80th/ 347
METRIC RANK
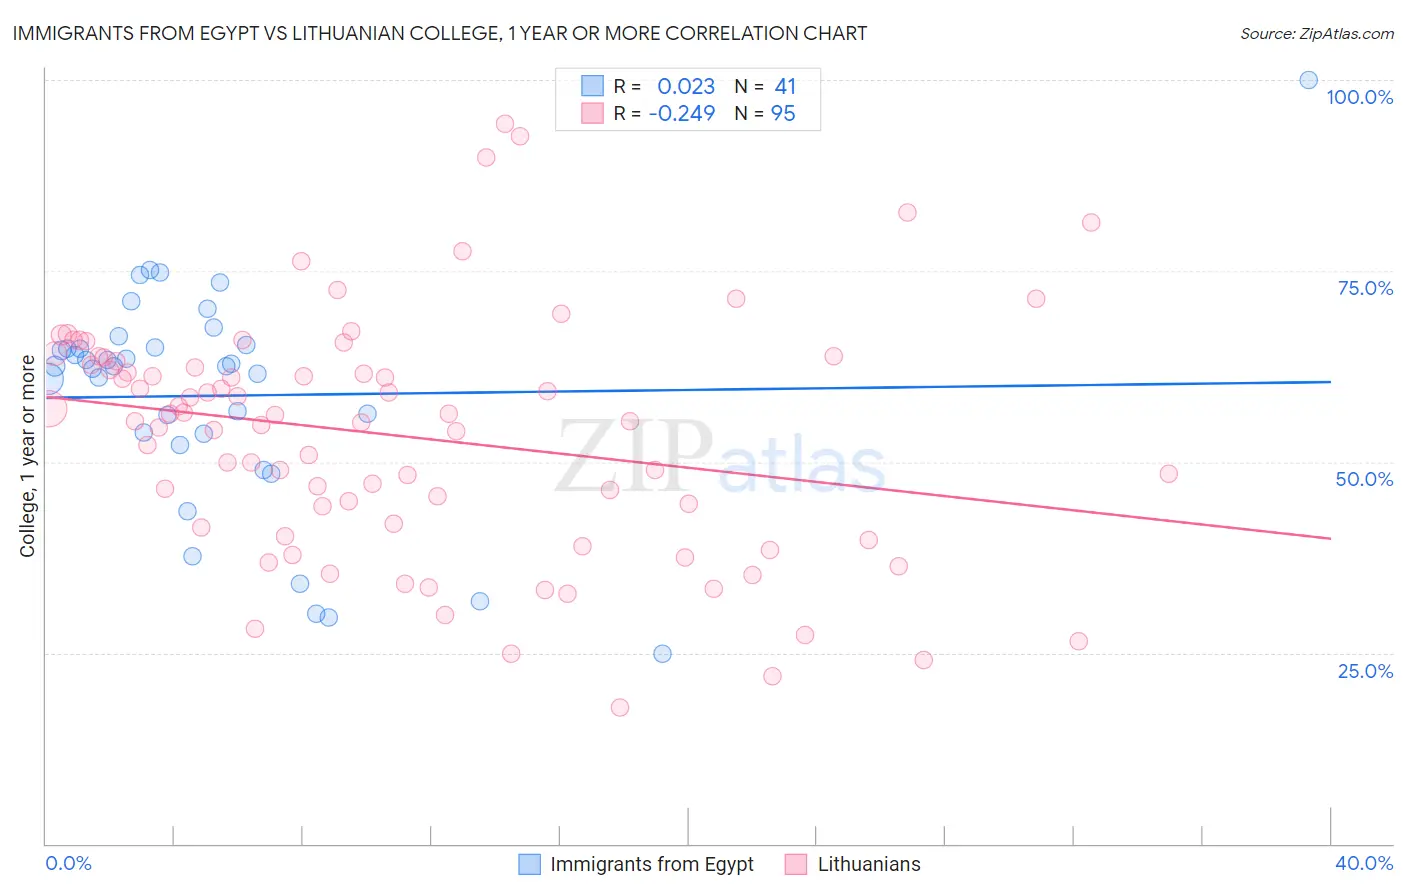
Immigrants from Egypt vs Lithuanian College, 1 year or more Correlation Chart
The statistical analysis conducted on geographies consisting of 245,485,794 people shows no correlation between the proportion of Immigrants from Egypt and percentage of population with at least college, 1 year or more education in the United States with a correlation coefficient (R) of 0.023 and weighted average of 62.4%. Similarly, the statistical analysis conducted on geographies consisting of 421,945,677 people shows a weak negative correlation between the proportion of Lithuanians and percentage of population with at least college, 1 year or more education in the United States with a correlation coefficient (R) of -0.249 and weighted average of 62.9%, a difference of 0.78%.
College, 1 year or more Correlation Summary
| Measurement | Immigrants from Egypt | Lithuanian |
| Minimum | 24.8% | 17.9% |
| Maximum | 100.0% | 94.2% |
| Range | 75.2% | 76.4% |
| Mean | 58.7% | 53.4% |
| Median | 62.6% | 55.4% |
| Interquartile 25% (IQ1) | 53.0% | 41.5% |
| Interquartile 75% (IQ3) | 65.1% | 63.2% |
| Interquartile Range (IQR) | 12.1% | 21.7% |
| Standard Deviation (Sample) | 14.7% | 15.7% |
| Standard Deviation (Population) | 14.5% | 15.7% |
Demographics Similar to Immigrants from Egypt and Lithuanians by College, 1 year or more
In terms of college, 1 year or more, the demographic groups most similar to Immigrants from Egypt are Immigrants from Eastern Europe (62.4%, a difference of 0.010%), Romanian (62.4%, a difference of 0.030%), Immigrants from Croatia (62.3%, a difference of 0.090%), Immigrants from Western Asia (62.5%, a difference of 0.11%), and British (62.3%, a difference of 0.19%). Similarly, the demographic groups most similar to Lithuanians are Northern European (62.9%, a difference of 0.040%), Immigrants from Lebanon (62.9%, a difference of 0.050%), Laotian (62.8%, a difference of 0.060%), Paraguayan (62.9%, a difference of 0.070%), and Ethiopian (62.9%, a difference of 0.070%).
| Demographics | Rating | Rank | College, 1 year or more |
| Paraguayans | 98.8 /100 | #76 | Exceptional 62.9% |
| Ethiopians | 98.8 /100 | #77 | Exceptional 62.9% |
| Immigrants | Lebanon | 98.8 /100 | #78 | Exceptional 62.9% |
| Northern Europeans | 98.8 /100 | #79 | Exceptional 62.9% |
| Lithuanians | 98.8 /100 | #80 | Exceptional 62.9% |
| Laotians | 98.7 /100 | #81 | Exceptional 62.8% |
| Immigrants | Bolivia | 98.7 /100 | #82 | Exceptional 62.8% |
| Immigrants | Argentina | 98.6 /100 | #83 | Exceptional 62.8% |
| Immigrants | England | 98.6 /100 | #84 | Exceptional 62.8% |
| Immigrants | Pakistan | 98.6 /100 | #85 | Exceptional 62.8% |
| Immigrants | Western Europe | 98.6 /100 | #86 | Exceptional 62.7% |
| Immigrants | Hungary | 98.6 /100 | #87 | Exceptional 62.7% |
| Greeks | 98.3 /100 | #88 | Exceptional 62.6% |
| Immigrants | Ethiopia | 98.2 /100 | #89 | Exceptional 62.6% |
| Immigrants | Western Asia | 97.9 /100 | #90 | Exceptional 62.5% |
| Immigrants | Eastern Europe | 97.8 /100 | #91 | Exceptional 62.4% |
| Immigrants | Egypt | 97.8 /100 | #92 | Exceptional 62.4% |
| Romanians | 97.7 /100 | #93 | Exceptional 62.4% |
| Immigrants | Croatia | 97.6 /100 | #94 | Exceptional 62.3% |
| British | 97.4 /100 | #95 | Exceptional 62.3% |
| Chinese | 97.2 /100 | #96 | Exceptional 62.2% |