Immigrants from Egypt vs Cree College, Under 1 year
COMPARE
Immigrants from Egypt
Cree
College, Under 1 year
College, Under 1 year Comparison
Immigrants from Egypt
Cree
67.7%
COLLEGE, UNDER 1 YEAR
96.0/ 100
METRIC RATING
108th/ 347
METRIC RANK
63.3%
COLLEGE, UNDER 1 YEAR
5.2/ 100
METRIC RATING
221st/ 347
METRIC RANK
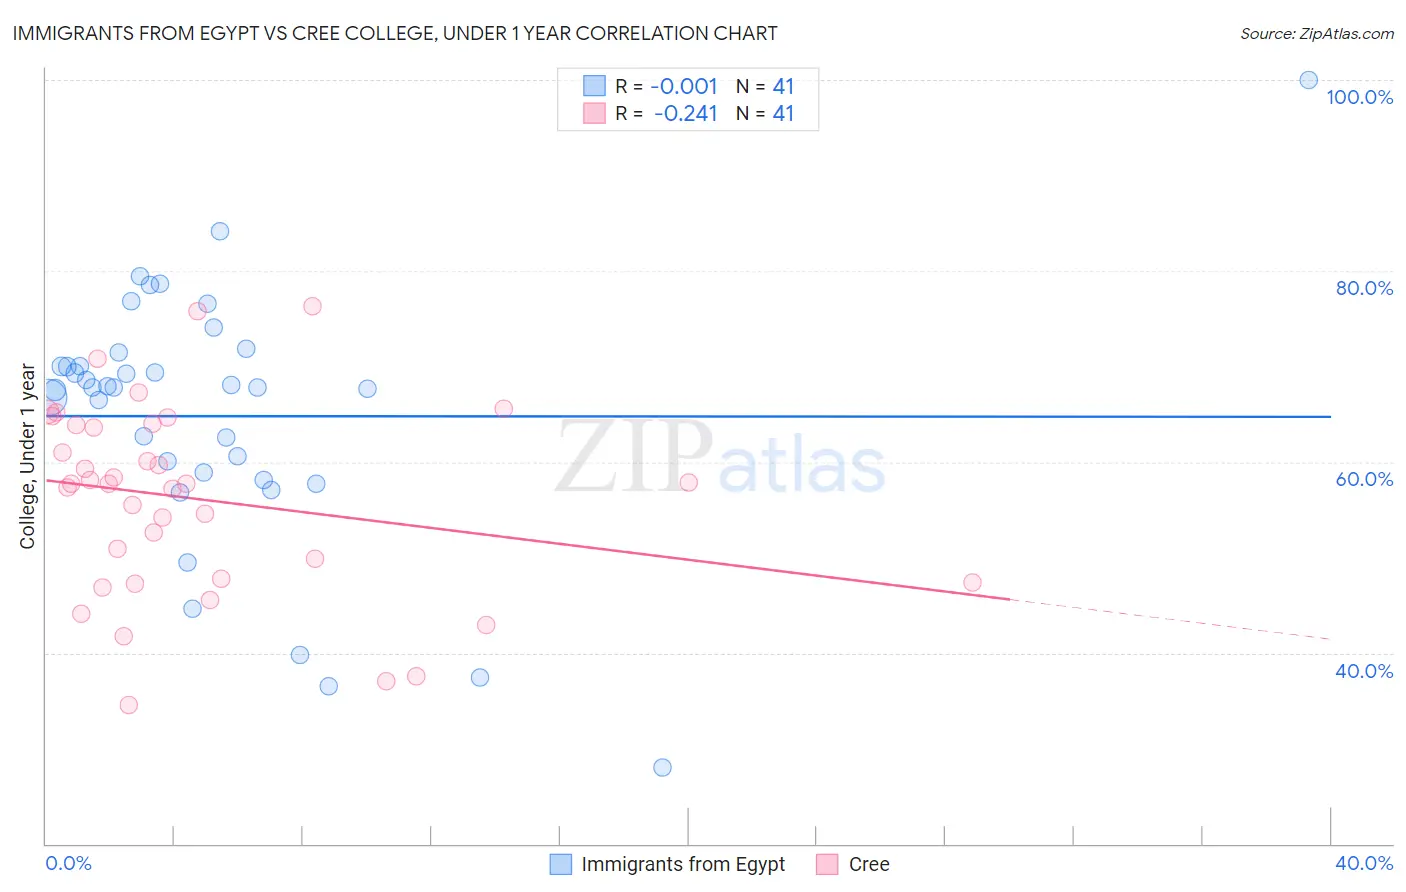
Immigrants from Egypt vs Cree College, Under 1 year Correlation Chart
The statistical analysis conducted on geographies consisting of 245,485,794 people shows no correlation between the proportion of Immigrants from Egypt and percentage of population with at least college, under 1 year education in the United States with a correlation coefficient (R) of -0.001 and weighted average of 67.7%. Similarly, the statistical analysis conducted on geographies consisting of 76,211,744 people shows a weak negative correlation between the proportion of Cree and percentage of population with at least college, under 1 year education in the United States with a correlation coefficient (R) of -0.241 and weighted average of 63.3%, a difference of 6.9%.
College, Under 1 year Correlation Summary
| Measurement | Immigrants from Egypt | Cree |
| Minimum | 28.0% | 34.5% |
| Maximum | 100.0% | 76.2% |
| Range | 72.0% | 41.7% |
| Mean | 64.8% | 56.1% |
| Median | 67.8% | 57.7% |
| Interquartile 25% (IQ1) | 58.6% | 47.5% |
| Interquartile 75% (IQ3) | 70.7% | 63.9% |
| Interquartile Range (IQR) | 12.1% | 16.4% |
| Standard Deviation (Sample) | 13.6% | 10.0% |
| Standard Deviation (Population) | 13.4% | 9.9% |
Similar Demographics by College, Under 1 year
Demographics Similar to Immigrants from Egypt by College, Under 1 year
In terms of college, under 1 year, the demographic groups most similar to Immigrants from Egypt are Scandinavian (67.7%, a difference of 0.060%), Assyrian/Chaldean/Syriac (67.7%, a difference of 0.060%), Ukrainian (67.7%, a difference of 0.060%), Macedonian (67.6%, a difference of 0.080%), and Syrian (67.6%, a difference of 0.11%).
| Demographics | Rating | Rank | College, Under 1 year |
| Immigrants | Eastern Europe | 96.9 /100 | #101 | Exceptional 67.9% |
| Palestinians | 96.9 /100 | #102 | Exceptional 67.9% |
| Carpatho Rusyns | 96.8 /100 | #103 | Exceptional 67.9% |
| Immigrants | Western Asia | 96.6 /100 | #104 | Exceptional 67.8% |
| Afghans | 96.6 /100 | #105 | Exceptional 67.8% |
| Immigrants | Croatia | 96.6 /100 | #106 | Exceptional 67.8% |
| Austrians | 96.4 /100 | #107 | Exceptional 67.8% |
| Immigrants | Egypt | 96.0 /100 | #108 | Exceptional 67.7% |
| Scandinavians | 95.8 /100 | #109 | Exceptional 67.7% |
| Assyrians/Chaldeans/Syriacs | 95.8 /100 | #110 | Exceptional 67.7% |
| Ukrainians | 95.8 /100 | #111 | Exceptional 67.7% |
| Macedonians | 95.7 /100 | #112 | Exceptional 67.6% |
| Syrians | 95.6 /100 | #113 | Exceptional 67.6% |
| Chileans | 95.3 /100 | #114 | Exceptional 67.6% |
| Basques | 95.2 /100 | #115 | Exceptional 67.6% |
Demographics Similar to Cree by College, Under 1 year
In terms of college, under 1 year, the demographic groups most similar to Cree are Immigrants from Senegal (63.3%, a difference of 0.050%), Portuguese (63.4%, a difference of 0.090%), Immigrants from Panama (63.4%, a difference of 0.11%), Immigrants from Fiji (63.4%, a difference of 0.11%), and Immigrants from Uruguay (63.4%, a difference of 0.14%).
| Demographics | Rating | Rank | College, Under 1 year |
| Immigrants | Nigeria | 8.8 /100 | #214 | Tragic 63.7% |
| Senegalese | 7.7 /100 | #215 | Tragic 63.6% |
| Hmong | 6.8 /100 | #216 | Tragic 63.5% |
| Immigrants | Uruguay | 5.8 /100 | #217 | Tragic 63.4% |
| Immigrants | Panama | 5.7 /100 | #218 | Tragic 63.4% |
| Immigrants | Fiji | 5.7 /100 | #219 | Tragic 63.4% |
| Portuguese | 5.6 /100 | #220 | Tragic 63.4% |
| Cree | 5.2 /100 | #221 | Tragic 63.3% |
| Immigrants | Senegal | 5.0 /100 | #222 | Tragic 63.3% |
| Immigrants | Costa Rica | 4.5 /100 | #223 | Tragic 63.2% |
| Sub-Saharan Africans | 4.4 /100 | #224 | Tragic 63.2% |
| Immigrants | Peru | 4.0 /100 | #225 | Tragic 63.1% |
| Immigrants | Colombia | 4.0 /100 | #226 | Tragic 63.1% |
| Immigrants | Ghana | 3.7 /100 | #227 | Tragic 63.1% |
| Samoans | 3.3 /100 | #228 | Tragic 63.0% |