Immigrants from Egypt vs Cuban College, 1 year or more
COMPARE
Immigrants from Egypt
Cuban
College, 1 year or more
College, 1 year or more Comparison
Immigrants from Egypt
Cubans
62.4%
COLLEGE, 1 YEAR OR MORE
97.8/ 100
METRIC RATING
92nd/ 347
METRIC RANK
53.4%
COLLEGE, 1 YEAR OR MORE
0.0/ 100
METRIC RATING
291st/ 347
METRIC RANK
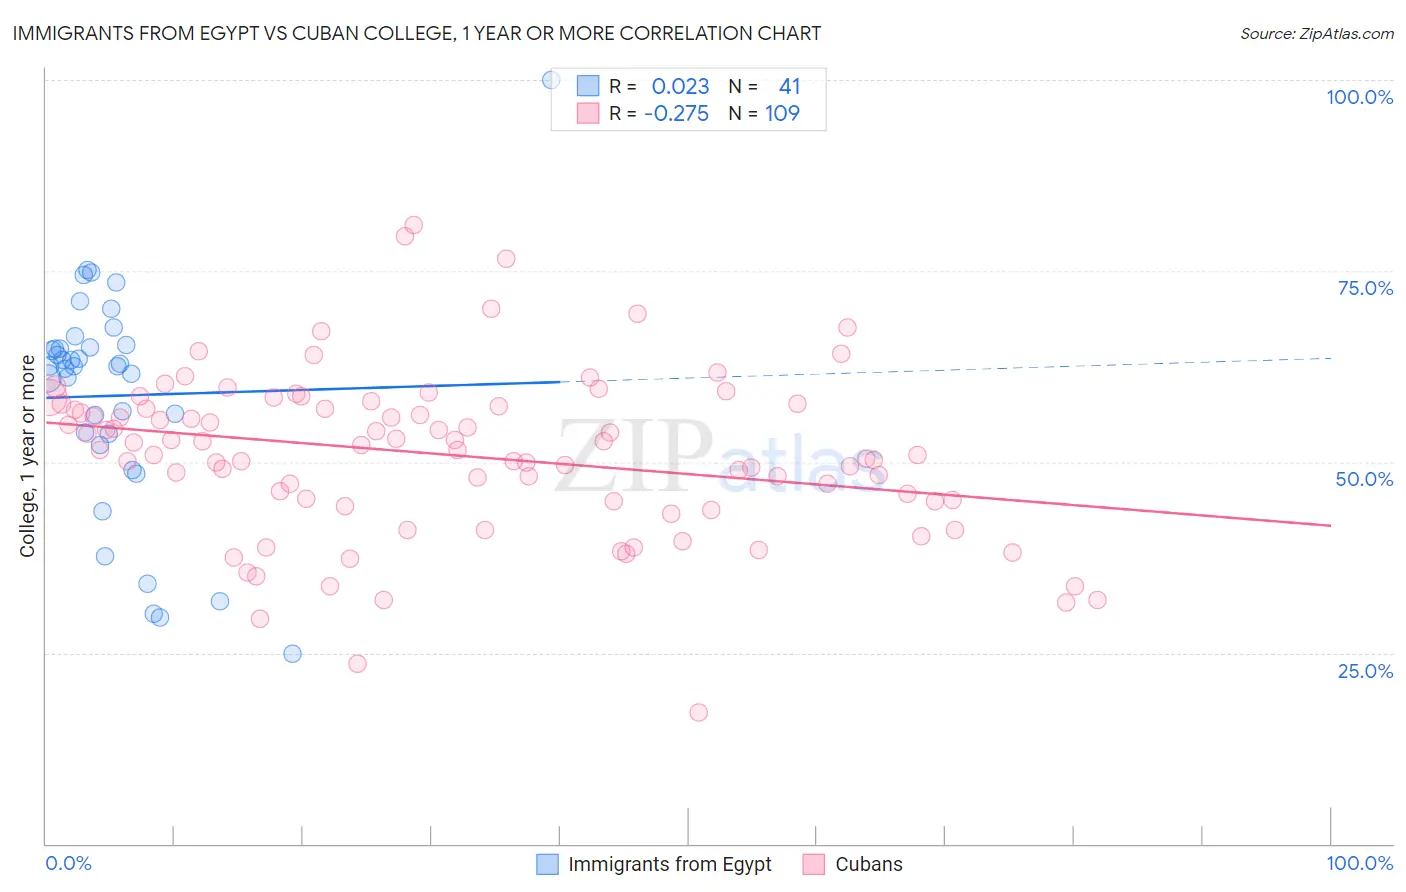
Immigrants from Egypt vs Cuban College, 1 year or more Correlation Chart
The statistical analysis conducted on geographies consisting of 245,485,794 people shows no correlation between the proportion of Immigrants from Egypt and percentage of population with at least college, 1 year or more education in the United States with a correlation coefficient (R) of 0.023 and weighted average of 62.4%. Similarly, the statistical analysis conducted on geographies consisting of 449,372,622 people shows a weak negative correlation between the proportion of Cubans and percentage of population with at least college, 1 year or more education in the United States with a correlation coefficient (R) of -0.275 and weighted average of 53.4%, a difference of 16.9%.
College, 1 year or more Correlation Summary
| Measurement | Immigrants from Egypt | Cuban |
| Minimum | 24.8% | 17.3% |
| Maximum | 100.0% | 81.0% |
| Range | 75.2% | 63.7% |
| Mean | 58.7% | 50.8% |
| Median | 62.6% | 51.5% |
| Interquartile 25% (IQ1) | 53.0% | 44.8% |
| Interquartile 75% (IQ3) | 65.1% | 57.4% |
| Interquartile Range (IQR) | 12.1% | 12.6% |
| Standard Deviation (Sample) | 14.7% | 10.8% |
| Standard Deviation (Population) | 14.5% | 10.8% |
Similar Demographics by College, 1 year or more
Demographics Similar to Immigrants from Egypt by College, 1 year or more
In terms of college, 1 year or more, the demographic groups most similar to Immigrants from Egypt are Immigrants from Eastern Europe (62.4%, a difference of 0.010%), Romanian (62.4%, a difference of 0.030%), Immigrants from Croatia (62.3%, a difference of 0.090%), Immigrants from Western Asia (62.5%, a difference of 0.11%), and British (62.3%, a difference of 0.19%).
| Demographics | Rating | Rank | College, 1 year or more |
| Immigrants | Pakistan | 98.6 /100 | #85 | Exceptional 62.8% |
| Immigrants | Western Europe | 98.6 /100 | #86 | Exceptional 62.7% |
| Immigrants | Hungary | 98.6 /100 | #87 | Exceptional 62.7% |
| Greeks | 98.3 /100 | #88 | Exceptional 62.6% |
| Immigrants | Ethiopia | 98.2 /100 | #89 | Exceptional 62.6% |
| Immigrants | Western Asia | 97.9 /100 | #90 | Exceptional 62.5% |
| Immigrants | Eastern Europe | 97.8 /100 | #91 | Exceptional 62.4% |
| Immigrants | Egypt | 97.8 /100 | #92 | Exceptional 62.4% |
| Romanians | 97.7 /100 | #93 | Exceptional 62.4% |
| Immigrants | Croatia | 97.6 /100 | #94 | Exceptional 62.3% |
| British | 97.4 /100 | #95 | Exceptional 62.3% |
| Chinese | 97.2 /100 | #96 | Exceptional 62.2% |
| Jordanians | 97.2 /100 | #97 | Exceptional 62.2% |
| Carpatho Rusyns | 97.2 /100 | #98 | Exceptional 62.2% |
| Croatians | 97.1 /100 | #99 | Exceptional 62.2% |
Demographics Similar to Cubans by College, 1 year or more
In terms of college, 1 year or more, the demographic groups most similar to Cubans are Alaskan Athabascan (53.4%, a difference of 0.050%), Alaska Native (53.4%, a difference of 0.070%), Immigrants from Ecuador (53.4%, a difference of 0.070%), Chickasaw (53.3%, a difference of 0.13%), and Black/African American (53.3%, a difference of 0.15%).
| Demographics | Rating | Rank | College, 1 year or more |
| Ute | 0.1 /100 | #284 | Tragic 53.8% |
| Immigrants | Guyana | 0.1 /100 | #285 | Tragic 53.5% |
| Central American Indians | 0.1 /100 | #286 | Tragic 53.5% |
| Immigrants | Belize | 0.1 /100 | #287 | Tragic 53.5% |
| Alaska Natives | 0.0 /100 | #288 | Tragic 53.4% |
| Immigrants | Ecuador | 0.0 /100 | #289 | Tragic 53.4% |
| Alaskan Athabascans | 0.0 /100 | #290 | Tragic 53.4% |
| Cubans | 0.0 /100 | #291 | Tragic 53.4% |
| Chickasaw | 0.0 /100 | #292 | Tragic 53.3% |
| Blacks/African Americans | 0.0 /100 | #293 | Tragic 53.3% |
| Cherokee | 0.0 /100 | #294 | Tragic 53.2% |
| Yaqui | 0.0 /100 | #295 | Tragic 53.2% |
| Sioux | 0.0 /100 | #296 | Tragic 53.0% |
| Paiute | 0.0 /100 | #297 | Tragic 52.9% |
| Immigrants | Dominica | 0.0 /100 | #298 | Tragic 52.5% |