Immigrants from Caribbean vs Swiss College, 1 year or more
COMPARE
Immigrants from Caribbean
Swiss
College, 1 year or more
College, 1 year or more Comparison
Immigrants from Caribbean
Swiss
51.4%
COLLEGE, 1 YEAR OR MORE
0.0/ 100
METRIC RATING
313th/ 347
METRIC RANK
59.2%
COLLEGE, 1 YEAR OR MORE
43.4/ 100
METRIC RATING
181st/ 347
METRIC RANK
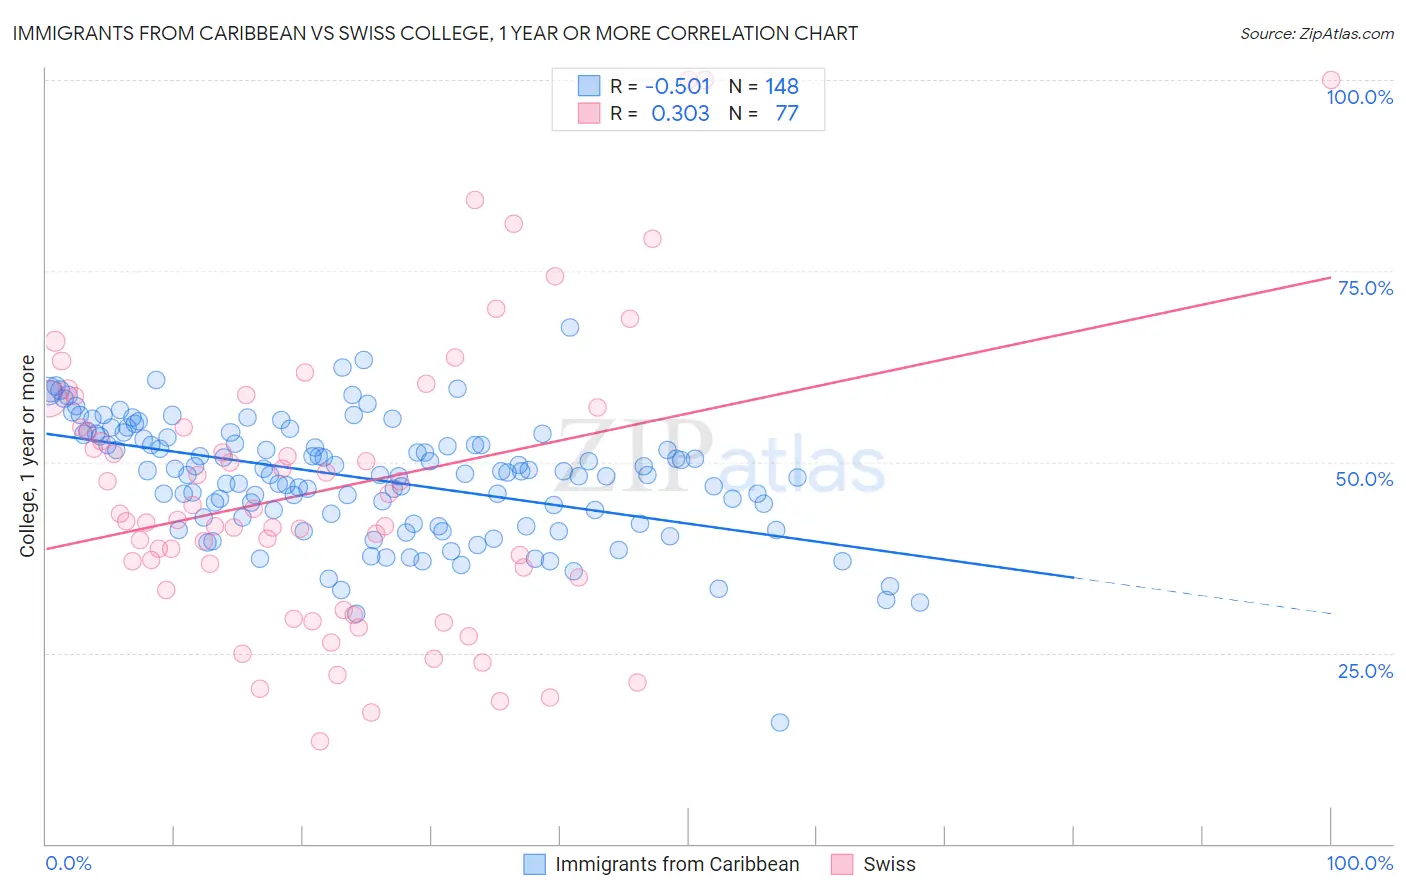
Immigrants from Caribbean vs Swiss College, 1 year or more Correlation Chart
The statistical analysis conducted on geographies consisting of 450,060,902 people shows a substantial negative correlation between the proportion of Immigrants from Caribbean and percentage of population with at least college, 1 year or more education in the United States with a correlation coefficient (R) of -0.501 and weighted average of 51.4%. Similarly, the statistical analysis conducted on geographies consisting of 465,017,348 people shows a mild positive correlation between the proportion of Swiss and percentage of population with at least college, 1 year or more education in the United States with a correlation coefficient (R) of 0.303 and weighted average of 59.2%, a difference of 15.1%.
College, 1 year or more Correlation Summary
| Measurement | Immigrants from Caribbean | Swiss |
| Minimum | 15.9% | 13.4% |
| Maximum | 67.7% | 100.0% |
| Range | 51.8% | 86.6% |
| Mean | 47.8% | 46.3% |
| Median | 48.6% | 42.4% |
| Interquartile 25% (IQ1) | 42.7% | 34.1% |
| Interquartile 75% (IQ3) | 53.3% | 55.8% |
| Interquartile Range (IQR) | 10.6% | 21.7% |
| Standard Deviation (Sample) | 7.8% | 18.9% |
| Standard Deviation (Population) | 7.7% | 18.8% |
Similar Demographics by College, 1 year or more
Demographics Similar to Immigrants from Caribbean by College, 1 year or more
In terms of college, 1 year or more, the demographic groups most similar to Immigrants from Caribbean are Pueblo (51.5%, a difference of 0.13%), Immigrants from Haiti (51.5%, a difference of 0.17%), Fijian (51.3%, a difference of 0.22%), Honduran (51.6%, a difference of 0.33%), and Guatemalan (51.2%, a difference of 0.45%).
| Demographics | Rating | Rank | College, 1 year or more |
| Mexican American Indians | 0.0 /100 | #306 | Tragic 51.9% |
| Immigrants | Portugal | 0.0 /100 | #307 | Tragic 51.9% |
| Salvadorans | 0.0 /100 | #308 | Tragic 51.8% |
| Apache | 0.0 /100 | #309 | Tragic 51.8% |
| Hondurans | 0.0 /100 | #310 | Tragic 51.6% |
| Immigrants | Haiti | 0.0 /100 | #311 | Tragic 51.5% |
| Pueblo | 0.0 /100 | #312 | Tragic 51.5% |
| Immigrants | Caribbean | 0.0 /100 | #313 | Tragic 51.4% |
| Fijians | 0.0 /100 | #314 | Tragic 51.3% |
| Guatemalans | 0.0 /100 | #315 | Tragic 51.2% |
| Cajuns | 0.0 /100 | #316 | Tragic 51.2% |
| Hispanics or Latinos | 0.0 /100 | #317 | Tragic 51.1% |
| Immigrants | Honduras | 0.0 /100 | #318 | Tragic 51.0% |
| Immigrants | El Salvador | 0.0 /100 | #319 | Tragic 51.0% |
| Kiowa | 0.0 /100 | #320 | Tragic 51.0% |
Demographics Similar to Swiss by College, 1 year or more
In terms of college, 1 year or more, the demographic groups most similar to Swiss are Immigrants from Bosnia and Herzegovina (59.2%, a difference of 0.030%), Yugoslavian (59.2%, a difference of 0.040%), Bermudan (59.3%, a difference of 0.17%), German Russian (59.1%, a difference of 0.22%), and Tlingit-Haida (59.4%, a difference of 0.27%).
| Demographics | Rating | Rank | College, 1 year or more |
| Celtics | 50.0 /100 | #174 | Average 59.4% |
| Sri Lankans | 49.0 /100 | #175 | Average 59.4% |
| Immigrants | Poland | 48.9 /100 | #176 | Average 59.4% |
| Tlingit-Haida | 48.4 /100 | #177 | Average 59.4% |
| Czechoslovakians | 48.3 /100 | #178 | Average 59.4% |
| Bermudans | 46.6 /100 | #179 | Average 59.3% |
| Yugoslavians | 44.1 /100 | #180 | Average 59.2% |
| Swiss | 43.4 /100 | #181 | Average 59.2% |
| Immigrants | Bosnia and Herzegovina | 42.8 /100 | #182 | Average 59.2% |
| German Russians | 39.3 /100 | #183 | Fair 59.1% |
| Spaniards | 38.3 /100 | #184 | Fair 59.0% |
| South Americans | 35.9 /100 | #185 | Fair 59.0% |
| Scotch-Irish | 34.7 /100 | #186 | Fair 58.9% |
| Germans | 34.7 /100 | #187 | Fair 58.9% |
| French | 34.4 /100 | #188 | Fair 58.9% |