Immigrants from Bangladesh vs Immigrants from Ghana Nursery School
COMPARE
Immigrants from Bangladesh
Immigrants from Ghana
Nursery School
Nursery School Comparison
Immigrants from Bangladesh
Immigrants from Ghana
96.9%
NURSERY SCHOOL
0.0/ 100
METRIC RATING
321st/ 347
METRIC RANK
97.4%
NURSERY SCHOOL
0.1/ 100
METRIC RATING
279th/ 347
METRIC RANK
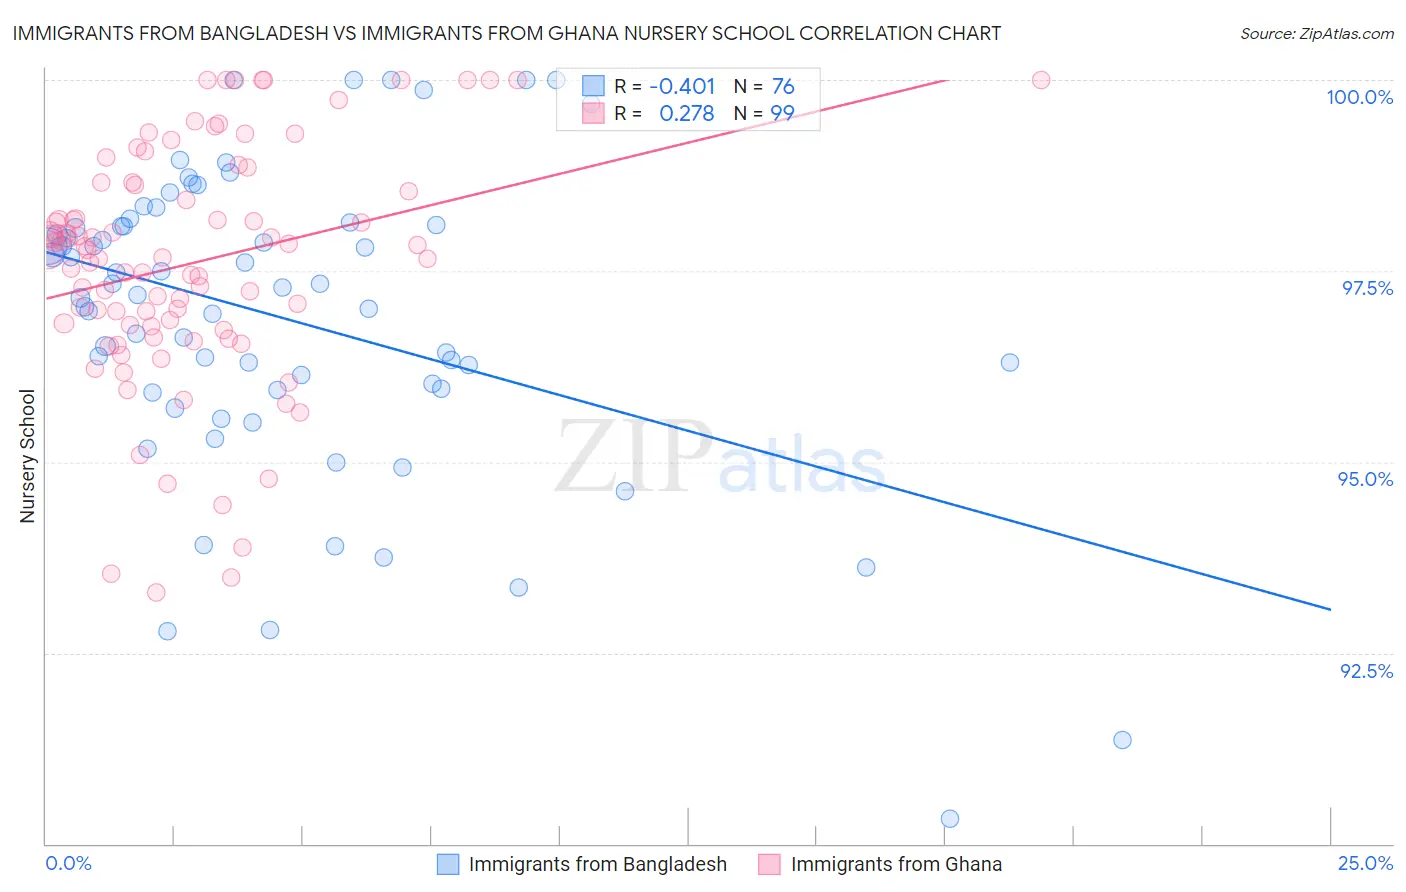
Immigrants from Bangladesh vs Immigrants from Ghana Nursery School Correlation Chart
The statistical analysis conducted on geographies consisting of 203,681,254 people shows a moderate negative correlation between the proportion of Immigrants from Bangladesh and percentage of population with at least nursery school education in the United States with a correlation coefficient (R) of -0.401 and weighted average of 96.9%. Similarly, the statistical analysis conducted on geographies consisting of 199,952,023 people shows a weak positive correlation between the proportion of Immigrants from Ghana and percentage of population with at least nursery school education in the United States with a correlation coefficient (R) of 0.278 and weighted average of 97.4%, a difference of 0.57%.
Nursery School Correlation Summary
| Measurement | Immigrants from Bangladesh | Immigrants from Ghana |
| Minimum | 90.3% | 93.3% |
| Maximum | 100.0% | 100.0% |
| Range | 9.7% | 6.7% |
| Mean | 96.9% | 97.6% |
| Median | 97.2% | 97.7% |
| Interquartile 25% (IQ1) | 96.0% | 96.8% |
| Interquartile 75% (IQ3) | 98.1% | 98.7% |
| Interquartile Range (IQR) | 2.1% | 1.9% |
| Standard Deviation (Sample) | 2.0% | 1.5% |
| Standard Deviation (Population) | 2.0% | 1.5% |
Similar Demographics by Nursery School
Demographics Similar to Immigrants from Bangladesh by Nursery School
In terms of nursery school, the demographic groups most similar to Immigrants from Bangladesh are Immigrants from Burma/Myanmar (96.9%, a difference of 0.0%), Immigrants from Laos (96.9%, a difference of 0.010%), Immigrants from Guyana (96.9%, a difference of 0.020%), Mexican American Indian (96.9%, a difference of 0.020%), and Immigrants from Honduras (96.9%, a difference of 0.020%).
| Demographics | Rating | Rank | Nursery School |
| Cape Verdeans | 0.0 /100 | #314 | Tragic 97.0% |
| Immigrants | Nicaragua | 0.0 /100 | #315 | Tragic 96.9% |
| Immigrants | Belize | 0.0 /100 | #316 | Tragic 96.9% |
| Immigrants | Ecuador | 0.0 /100 | #317 | Tragic 96.9% |
| Immigrants | Guyana | 0.0 /100 | #318 | Tragic 96.9% |
| Immigrants | Laos | 0.0 /100 | #319 | Tragic 96.9% |
| Immigrants | Burma/Myanmar | 0.0 /100 | #320 | Tragic 96.9% |
| Immigrants | Bangladesh | 0.0 /100 | #321 | Tragic 96.9% |
| Mexican American Indians | 0.0 /100 | #322 | Tragic 96.9% |
| Immigrants | Honduras | 0.0 /100 | #323 | Tragic 96.9% |
| Vietnamese | 0.0 /100 | #324 | Tragic 96.8% |
| Dominicans | 0.0 /100 | #325 | Tragic 96.8% |
| Indonesians | 0.0 /100 | #326 | Tragic 96.8% |
| Mexicans | 0.0 /100 | #327 | Tragic 96.8% |
| Immigrants | Latin America | 0.0 /100 | #328 | Tragic 96.7% |
Demographics Similar to Immigrants from Ghana by Nursery School
In terms of nursery school, the demographic groups most similar to Immigrants from Ghana are Barbadian (97.4%, a difference of 0.0%), Trinidadian and Tobagonian (97.4%, a difference of 0.0%), Immigrants from Uzbekistan (97.4%, a difference of 0.010%), Afghan (97.4%, a difference of 0.010%), and Immigrants from Western Africa (97.4%, a difference of 0.020%).
| Demographics | Rating | Rank | Nursery School |
| Immigrants | Bolivia | 0.1 /100 | #272 | Tragic 97.5% |
| Immigrants | China | 0.1 /100 | #273 | Tragic 97.5% |
| Immigrants | Cameroon | 0.1 /100 | #274 | Tragic 97.5% |
| Ghanaians | 0.1 /100 | #275 | Tragic 97.5% |
| Immigrants | Philippines | 0.1 /100 | #276 | Tragic 97.5% |
| Immigrants | Western Africa | 0.1 /100 | #277 | Tragic 97.4% |
| Immigrants | Uzbekistan | 0.1 /100 | #278 | Tragic 97.4% |
| Immigrants | Ghana | 0.1 /100 | #279 | Tragic 97.4% |
| Barbadians | 0.0 /100 | #280 | Tragic 97.4% |
| Trinidadians and Tobagonians | 0.0 /100 | #281 | Tragic 97.4% |
| Afghans | 0.0 /100 | #282 | Tragic 97.4% |
| Immigrants | West Indies | 0.0 /100 | #283 | Tragic 97.4% |
| Immigrants | Trinidad and Tobago | 0.0 /100 | #284 | Tragic 97.4% |
| Immigrants | Barbados | 0.0 /100 | #285 | Tragic 97.4% |
| Immigrants | Portugal | 0.0 /100 | #286 | Tragic 97.4% |