Thai vs Immigrants from Ghana Nursery School
COMPARE
Thai
Immigrants from Ghana
Nursery School
Nursery School Comparison
Thais
Immigrants from Ghana
98.2%
NURSERY SCHOOL
95.0/ 100
METRIC RATING
119th/ 347
METRIC RANK
97.4%
NURSERY SCHOOL
0.1/ 100
METRIC RATING
279th/ 347
METRIC RANK
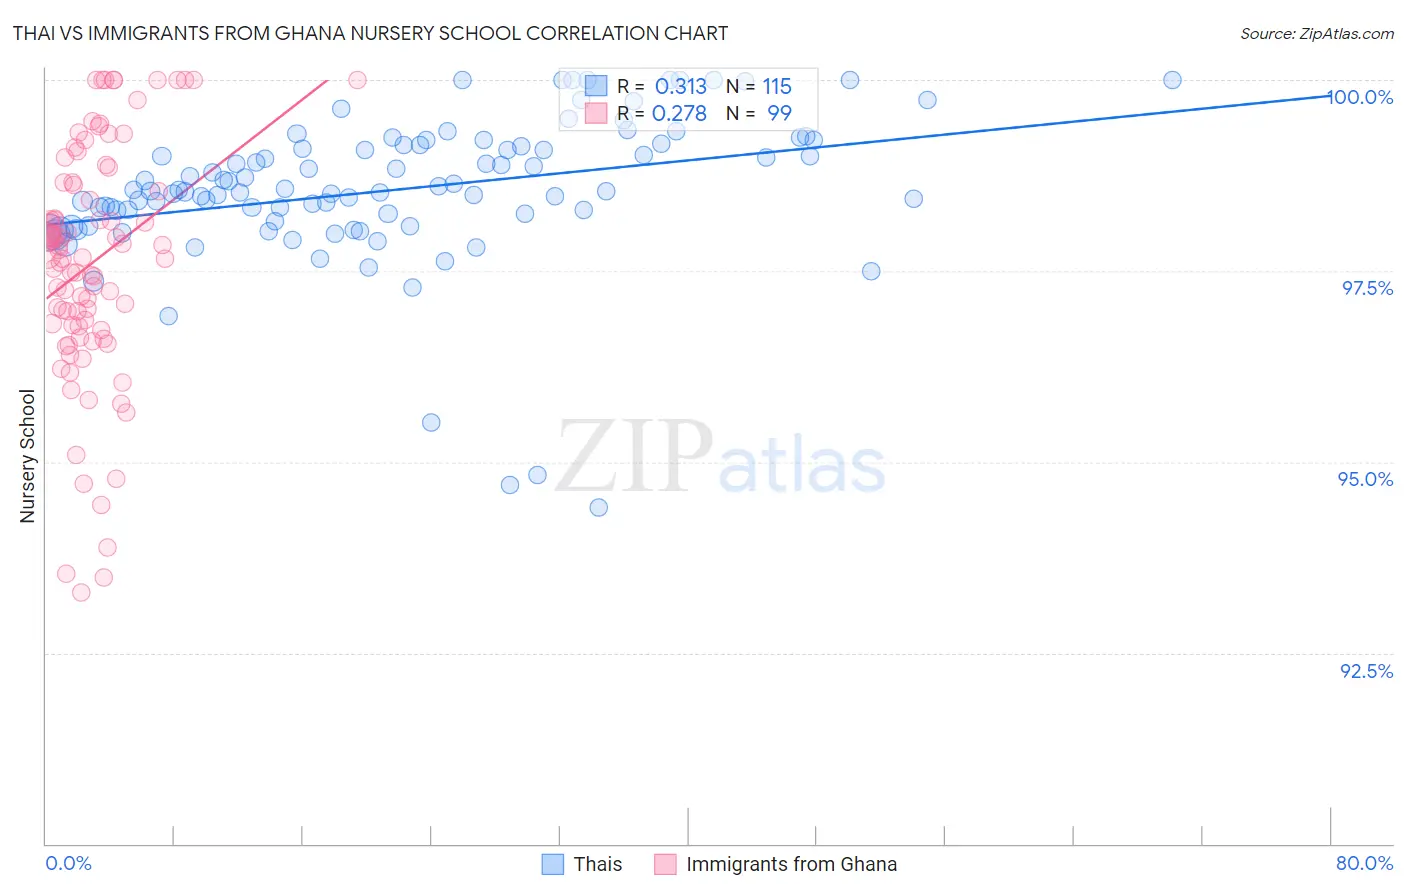
Thai vs Immigrants from Ghana Nursery School Correlation Chart
The statistical analysis conducted on geographies consisting of 475,866,115 people shows a mild positive correlation between the proportion of Thais and percentage of population with at least nursery school education in the United States with a correlation coefficient (R) of 0.313 and weighted average of 98.2%. Similarly, the statistical analysis conducted on geographies consisting of 199,952,023 people shows a weak positive correlation between the proportion of Immigrants from Ghana and percentage of population with at least nursery school education in the United States with a correlation coefficient (R) of 0.278 and weighted average of 97.4%, a difference of 0.80%.
Nursery School Correlation Summary
| Measurement | Thai | Immigrants from Ghana |
| Minimum | 94.4% | 93.3% |
| Maximum | 100.0% | 100.0% |
| Range | 5.6% | 6.7% |
| Mean | 98.6% | 97.6% |
| Median | 98.6% | 97.7% |
| Interquartile 25% (IQ1) | 98.2% | 96.8% |
| Interquartile 75% (IQ3) | 99.1% | 98.7% |
| Interquartile Range (IQR) | 0.99% | 1.9% |
| Standard Deviation (Sample) | 0.98% | 1.5% |
| Standard Deviation (Population) | 0.97% | 1.5% |
Similar Demographics by Nursery School
Demographics Similar to Thais by Nursery School
In terms of nursery school, the demographic groups most similar to Thais are Spanish (98.2%, a difference of 0.010%), Immigrants from France (98.2%, a difference of 0.010%), Yugoslavian (98.2%, a difference of 0.010%), Okinawan (98.2%, a difference of 0.010%), and Immigrants from Zimbabwe (98.2%, a difference of 0.010%).
| Demographics | Rating | Rank | Nursery School |
| Immigrants | Norway | 96.6 /100 | #112 | Exceptional 98.2% |
| Immigrants | Latvia | 96.4 /100 | #113 | Exceptional 98.2% |
| Ute | 96.4 /100 | #114 | Exceptional 98.2% |
| Iranians | 96.3 /100 | #115 | Exceptional 98.2% |
| Spanish | 95.8 /100 | #116 | Exceptional 98.2% |
| Immigrants | France | 95.6 /100 | #117 | Exceptional 98.2% |
| Yugoslavians | 95.4 /100 | #118 | Exceptional 98.2% |
| Thais | 95.0 /100 | #119 | Exceptional 98.2% |
| Okinawans | 94.5 /100 | #120 | Exceptional 98.2% |
| Immigrants | Zimbabwe | 94.2 /100 | #121 | Exceptional 98.2% |
| Immigrants | Japan | 94.0 /100 | #122 | Exceptional 98.2% |
| Syrians | 93.9 /100 | #123 | Exceptional 98.2% |
| Lebanese | 93.8 /100 | #124 | Exceptional 98.2% |
| Iroquois | 93.7 /100 | #125 | Exceptional 98.2% |
| Menominee | 93.6 /100 | #126 | Exceptional 98.2% |
Demographics Similar to Immigrants from Ghana by Nursery School
In terms of nursery school, the demographic groups most similar to Immigrants from Ghana are Barbadian (97.4%, a difference of 0.0%), Trinidadian and Tobagonian (97.4%, a difference of 0.0%), Immigrants from Uzbekistan (97.4%, a difference of 0.010%), Afghan (97.4%, a difference of 0.010%), and Immigrants from Western Africa (97.4%, a difference of 0.020%).
| Demographics | Rating | Rank | Nursery School |
| Immigrants | Bolivia | 0.1 /100 | #272 | Tragic 97.5% |
| Immigrants | China | 0.1 /100 | #273 | Tragic 97.5% |
| Immigrants | Cameroon | 0.1 /100 | #274 | Tragic 97.5% |
| Ghanaians | 0.1 /100 | #275 | Tragic 97.5% |
| Immigrants | Philippines | 0.1 /100 | #276 | Tragic 97.5% |
| Immigrants | Western Africa | 0.1 /100 | #277 | Tragic 97.4% |
| Immigrants | Uzbekistan | 0.1 /100 | #278 | Tragic 97.4% |
| Immigrants | Ghana | 0.1 /100 | #279 | Tragic 97.4% |
| Barbadians | 0.0 /100 | #280 | Tragic 97.4% |
| Trinidadians and Tobagonians | 0.0 /100 | #281 | Tragic 97.4% |
| Afghans | 0.0 /100 | #282 | Tragic 97.4% |
| Immigrants | West Indies | 0.0 /100 | #283 | Tragic 97.4% |
| Immigrants | Trinidad and Tobago | 0.0 /100 | #284 | Tragic 97.4% |
| Immigrants | Barbados | 0.0 /100 | #285 | Tragic 97.4% |
| Immigrants | Portugal | 0.0 /100 | #286 | Tragic 97.4% |