Immigrants from Bangladesh vs Immigrants from Ghana In Labor Force | Age 16-19
COMPARE
Immigrants from Bangladesh
Immigrants from Ghana
In Labor Force | Age 16-19
In Labor Force | Age 16-19 Comparison
Immigrants from Bangladesh
Immigrants from Ghana
30.0%
IN LABOR FORCE | AGE 16-19
0.0/ 100
METRIC RATING
337th/ 347
METRIC RANK
35.4%
IN LABOR FORCE | AGE 16-19
7.3/ 100
METRIC RATING
222nd/ 347
METRIC RANK
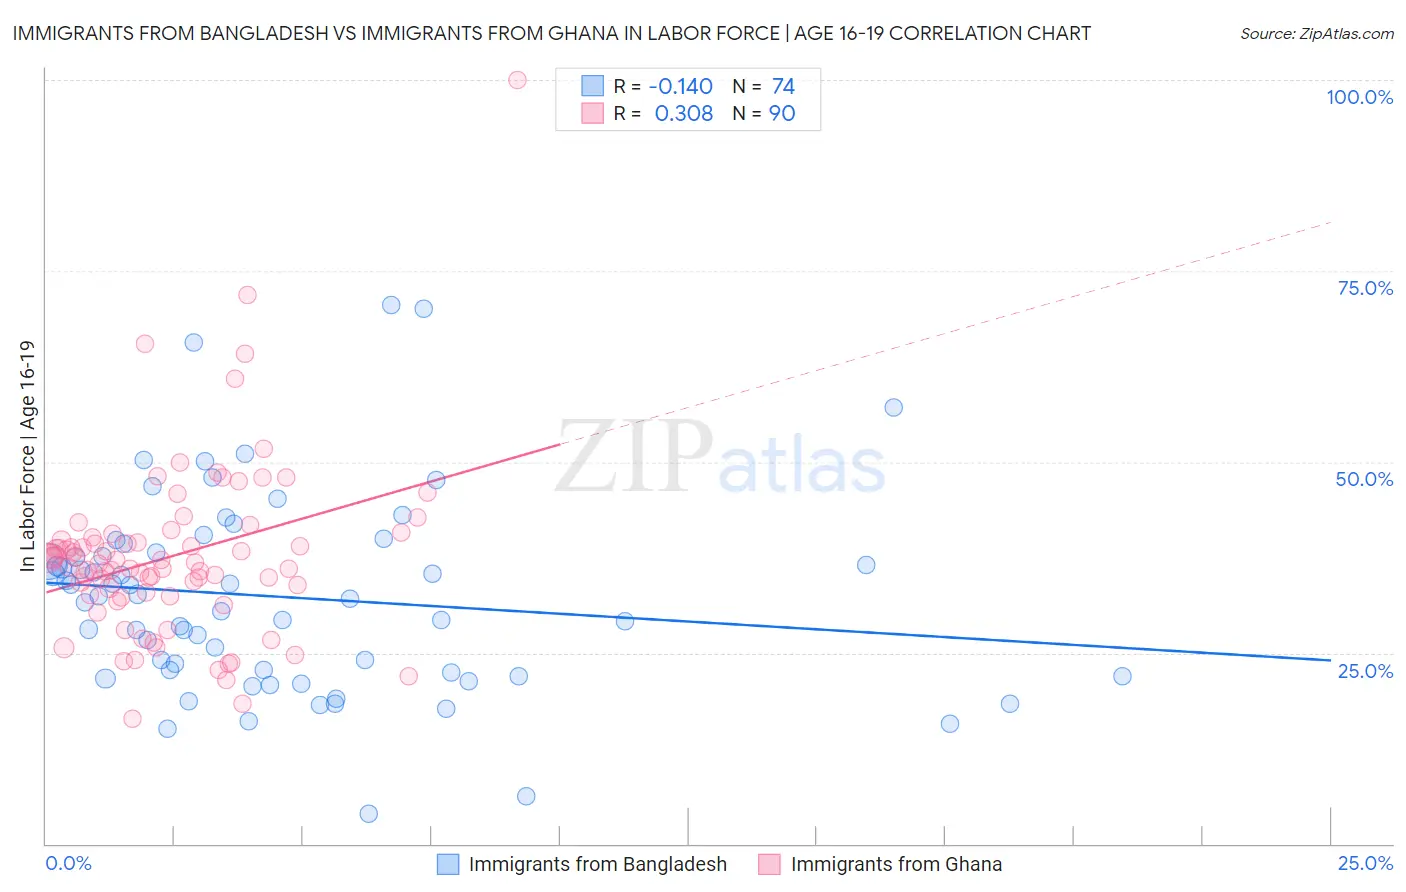
Immigrants from Bangladesh vs Immigrants from Ghana In Labor Force | Age 16-19 Correlation Chart
The statistical analysis conducted on geographies consisting of 203,549,433 people shows a poor negative correlation between the proportion of Immigrants from Bangladesh and labor force participation rate among population between the ages 16 and 19 in the United States with a correlation coefficient (R) of -0.140 and weighted average of 30.0%. Similarly, the statistical analysis conducted on geographies consisting of 199,826,706 people shows a mild positive correlation between the proportion of Immigrants from Ghana and labor force participation rate among population between the ages 16 and 19 in the United States with a correlation coefficient (R) of 0.308 and weighted average of 35.4%, a difference of 17.8%.
In Labor Force | Age 16-19 Correlation Summary
| Measurement | Immigrants from Bangladesh | Immigrants from Ghana |
| Minimum | 3.9% | 16.3% |
| Maximum | 70.6% | 100.0% |
| Range | 66.7% | 83.7% |
| Mean | 32.3% | 37.7% |
| Median | 32.2% | 36.7% |
| Interquartile 25% (IQ1) | 22.5% | 32.5% |
| Interquartile 75% (IQ3) | 38.2% | 40.1% |
| Interquartile Range (IQR) | 15.7% | 7.5% |
| Standard Deviation (Sample) | 13.0% | 11.6% |
| Standard Deviation (Population) | 12.9% | 11.6% |
Similar Demographics by In Labor Force | Age 16-19
Demographics Similar to Immigrants from Bangladesh by In Labor Force | Age 16-19
In terms of in labor force | age 16-19, the demographic groups most similar to Immigrants from Bangladesh are Immigrants from Trinidad and Tobago (30.2%, a difference of 0.37%), Immigrants from Cuba (30.2%, a difference of 0.66%), Puerto Rican (30.3%, a difference of 0.99%), Immigrants from Hong Kong (30.5%, a difference of 1.4%), and Immigrants from Israel (30.5%, a difference of 1.4%).
| Demographics | Rating | Rank | In Labor Force | Age 16-19 |
| Lumbee | 0.0 /100 | #330 | Tragic 31.0% |
| Trinidadians and Tobagonians | 0.0 /100 | #331 | Tragic 30.9% |
| Immigrants | Israel | 0.0 /100 | #332 | Tragic 30.5% |
| Immigrants | Hong Kong | 0.0 /100 | #333 | Tragic 30.5% |
| Puerto Ricans | 0.0 /100 | #334 | Tragic 30.3% |
| Immigrants | Cuba | 0.0 /100 | #335 | Tragic 30.2% |
| Immigrants | Trinidad and Tobago | 0.0 /100 | #336 | Tragic 30.2% |
| Immigrants | Bangladesh | 0.0 /100 | #337 | Tragic 30.0% |
| Vietnamese | 0.0 /100 | #338 | Tragic 29.6% |
| Immigrants | Uzbekistan | 0.0 /100 | #339 | Tragic 29.2% |
| British West Indians | 0.0 /100 | #340 | Tragic 29.1% |
| Immigrants | Armenia | 0.0 /100 | #341 | Tragic 29.0% |
| Immigrants | Barbados | 0.0 /100 | #342 | Tragic 29.0% |
| Yuman | 0.0 /100 | #343 | Tragic 27.7% |
| Guyanese | 0.0 /100 | #344 | Tragic 27.4% |
Demographics Similar to Immigrants from Ghana by In Labor Force | Age 16-19
In terms of in labor force | age 16-19, the demographic groups most similar to Immigrants from Ghana are Turkish (35.4%, a difference of 0.010%), Ghanaian (35.3%, a difference of 0.15%), Honduran (35.3%, a difference of 0.16%), Immigrants from Bahamas (35.5%, a difference of 0.19%), and Guatemalan (35.5%, a difference of 0.24%).
| Demographics | Rating | Rank | In Labor Force | Age 16-19 |
| Immigrants | South Eastern Asia | 10.8 /100 | #215 | Poor 35.6% |
| Dutch West Indians | 10.7 /100 | #216 | Poor 35.6% |
| Immigrants | Costa Rica | 10.7 /100 | #217 | Poor 35.6% |
| Sri Lankans | 9.8 /100 | #218 | Tragic 35.5% |
| Guatemalans | 8.6 /100 | #219 | Tragic 35.5% |
| Immigrants | Bahamas | 8.3 /100 | #220 | Tragic 35.5% |
| Turks | 7.3 /100 | #221 | Tragic 35.4% |
| Immigrants | Ghana | 7.3 /100 | #222 | Tragic 35.4% |
| Ghanaians | 6.5 /100 | #223 | Tragic 35.3% |
| Hondurans | 6.5 /100 | #224 | Tragic 35.3% |
| Immigrants | Belgium | 6.1 /100 | #225 | Tragic 35.3% |
| Immigrants | Guatemala | 5.7 /100 | #226 | Tragic 35.3% |
| Mongolians | 5.7 /100 | #227 | Tragic 35.3% |
| Immigrants | Senegal | 5.5 /100 | #228 | Tragic 35.3% |
| Immigrants | Lebanon | 5.0 /100 | #229 | Tragic 35.2% |