Immigrants from Bangladesh vs Celtic Nursery School
COMPARE
Immigrants from Bangladesh
Celtic
Nursery School
Nursery School Comparison
Immigrants from Bangladesh
Celtics
96.9%
NURSERY SCHOOL
0.0/ 100
METRIC RATING
321st/ 347
METRIC RANK
98.5%
NURSERY SCHOOL
99.8/ 100
METRIC RATING
50th/ 347
METRIC RANK
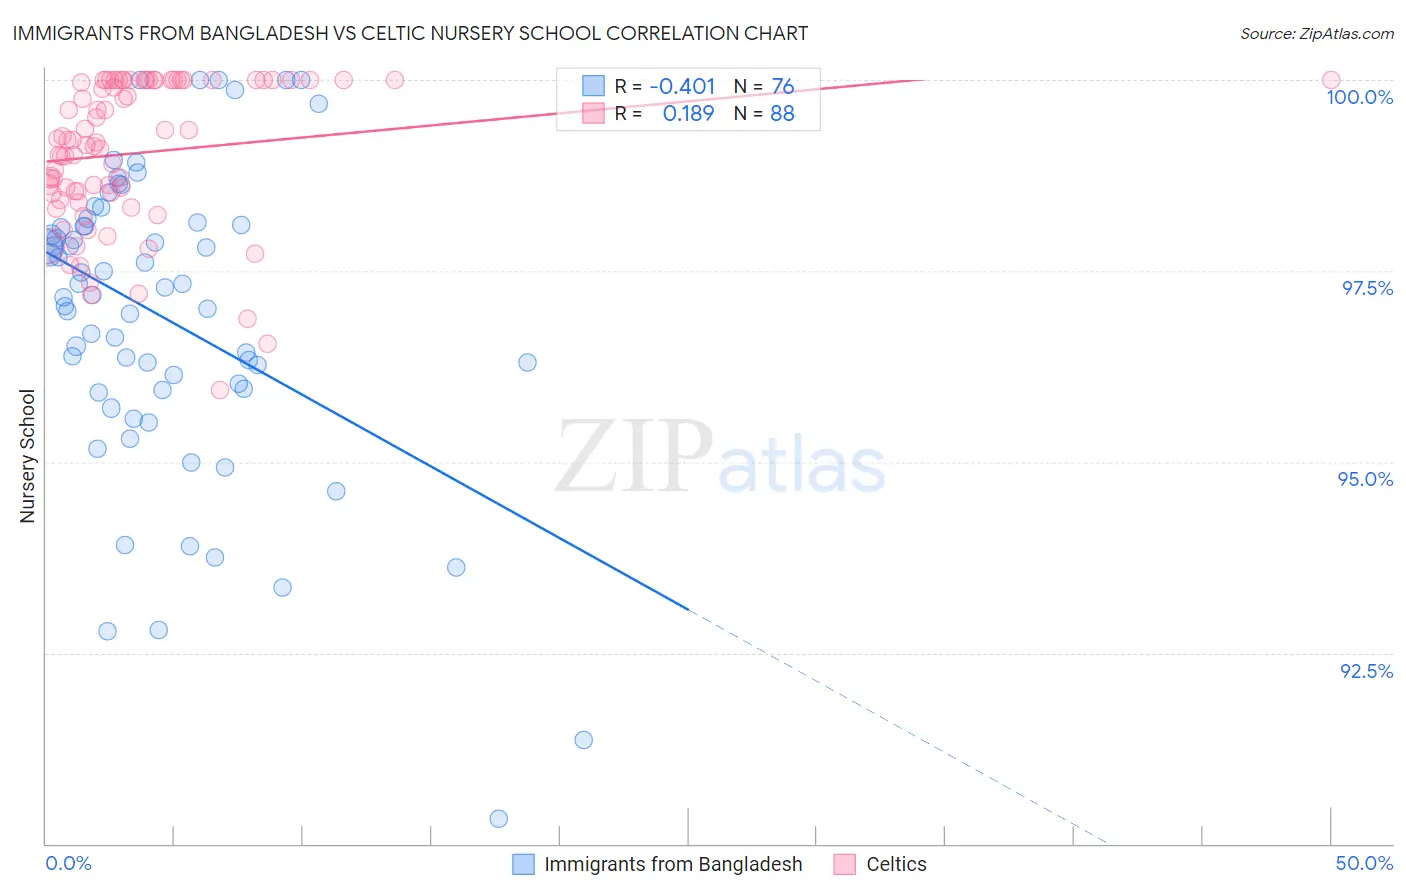
Immigrants from Bangladesh vs Celtic Nursery School Correlation Chart
The statistical analysis conducted on geographies consisting of 203,681,254 people shows a moderate negative correlation between the proportion of Immigrants from Bangladesh and percentage of population with at least nursery school education in the United States with a correlation coefficient (R) of -0.401 and weighted average of 96.9%. Similarly, the statistical analysis conducted on geographies consisting of 168,875,705 people shows a poor positive correlation between the proportion of Celtics and percentage of population with at least nursery school education in the United States with a correlation coefficient (R) of 0.189 and weighted average of 98.5%, a difference of 1.6%.
Nursery School Correlation Summary
| Measurement | Immigrants from Bangladesh | Celtic |
| Minimum | 90.3% | 95.9% |
| Maximum | 100.0% | 100.0% |
| Range | 9.7% | 4.1% |
| Mean | 96.9% | 99.0% |
| Median | 97.2% | 99.2% |
| Interquartile 25% (IQ1) | 96.0% | 98.5% |
| Interquartile 75% (IQ3) | 98.1% | 100.0% |
| Interquartile Range (IQR) | 2.1% | 1.5% |
| Standard Deviation (Sample) | 2.0% | 0.96% |
| Standard Deviation (Population) | 2.0% | 0.95% |
Similar Demographics by Nursery School
Demographics Similar to Immigrants from Bangladesh by Nursery School
In terms of nursery school, the demographic groups most similar to Immigrants from Bangladesh are Immigrants from Burma/Myanmar (96.9%, a difference of 0.0%), Immigrants from Laos (96.9%, a difference of 0.010%), Immigrants from Guyana (96.9%, a difference of 0.020%), Mexican American Indian (96.9%, a difference of 0.020%), and Immigrants from Honduras (96.9%, a difference of 0.020%).
| Demographics | Rating | Rank | Nursery School |
| Cape Verdeans | 0.0 /100 | #314 | Tragic 97.0% |
| Immigrants | Nicaragua | 0.0 /100 | #315 | Tragic 96.9% |
| Immigrants | Belize | 0.0 /100 | #316 | Tragic 96.9% |
| Immigrants | Ecuador | 0.0 /100 | #317 | Tragic 96.9% |
| Immigrants | Guyana | 0.0 /100 | #318 | Tragic 96.9% |
| Immigrants | Laos | 0.0 /100 | #319 | Tragic 96.9% |
| Immigrants | Burma/Myanmar | 0.0 /100 | #320 | Tragic 96.9% |
| Immigrants | Bangladesh | 0.0 /100 | #321 | Tragic 96.9% |
| Mexican American Indians | 0.0 /100 | #322 | Tragic 96.9% |
| Immigrants | Honduras | 0.0 /100 | #323 | Tragic 96.9% |
| Vietnamese | 0.0 /100 | #324 | Tragic 96.8% |
| Dominicans | 0.0 /100 | #325 | Tragic 96.8% |
| Indonesians | 0.0 /100 | #326 | Tragic 96.8% |
| Mexicans | 0.0 /100 | #327 | Tragic 96.8% |
| Immigrants | Latin America | 0.0 /100 | #328 | Tragic 96.7% |
Demographics Similar to Celtics by Nursery School
In terms of nursery school, the demographic groups most similar to Celtics are Ottawa (98.5%, a difference of 0.0%), White/Caucasian (98.5%, a difference of 0.0%), Estonian (98.5%, a difference of 0.0%), Australian (98.5%, a difference of 0.0%), and Czechoslovakian (98.5%, a difference of 0.010%).
| Demographics | Rating | Rank | Nursery School |
| Native Hawaiians | 99.9 /100 | #43 | Exceptional 98.5% |
| Belgians | 99.9 /100 | #44 | Exceptional 98.5% |
| Northern Europeans | 99.9 /100 | #45 | Exceptional 98.5% |
| Hungarians | 99.9 /100 | #46 | Exceptional 98.5% |
| Czechoslovakians | 99.9 /100 | #47 | Exceptional 98.5% |
| Ottawa | 99.8 /100 | #48 | Exceptional 98.5% |
| Whites/Caucasians | 99.8 /100 | #49 | Exceptional 98.5% |
| Celtics | 99.8 /100 | #50 | Exceptional 98.5% |
| Estonians | 99.8 /100 | #51 | Exceptional 98.5% |
| Australians | 99.8 /100 | #52 | Exceptional 98.5% |
| Kiowa | 99.8 /100 | #53 | Exceptional 98.4% |
| Pueblo | 99.8 /100 | #54 | Exceptional 98.4% |
| Immigrants | Scotland | 99.8 /100 | #55 | Exceptional 98.4% |
| Americans | 99.8 /100 | #56 | Exceptional 98.4% |
| Austrians | 99.8 /100 | #57 | Exceptional 98.4% |