Czechoslovakian vs Immigrants from Ghana Nursery School
COMPARE
Czechoslovakian
Immigrants from Ghana
Nursery School
Nursery School Comparison
Czechoslovakians
Immigrants from Ghana
98.5%
NURSERY SCHOOL
99.9/ 100
METRIC RATING
47th/ 347
METRIC RANK
97.4%
NURSERY SCHOOL
0.1/ 100
METRIC RATING
279th/ 347
METRIC RANK
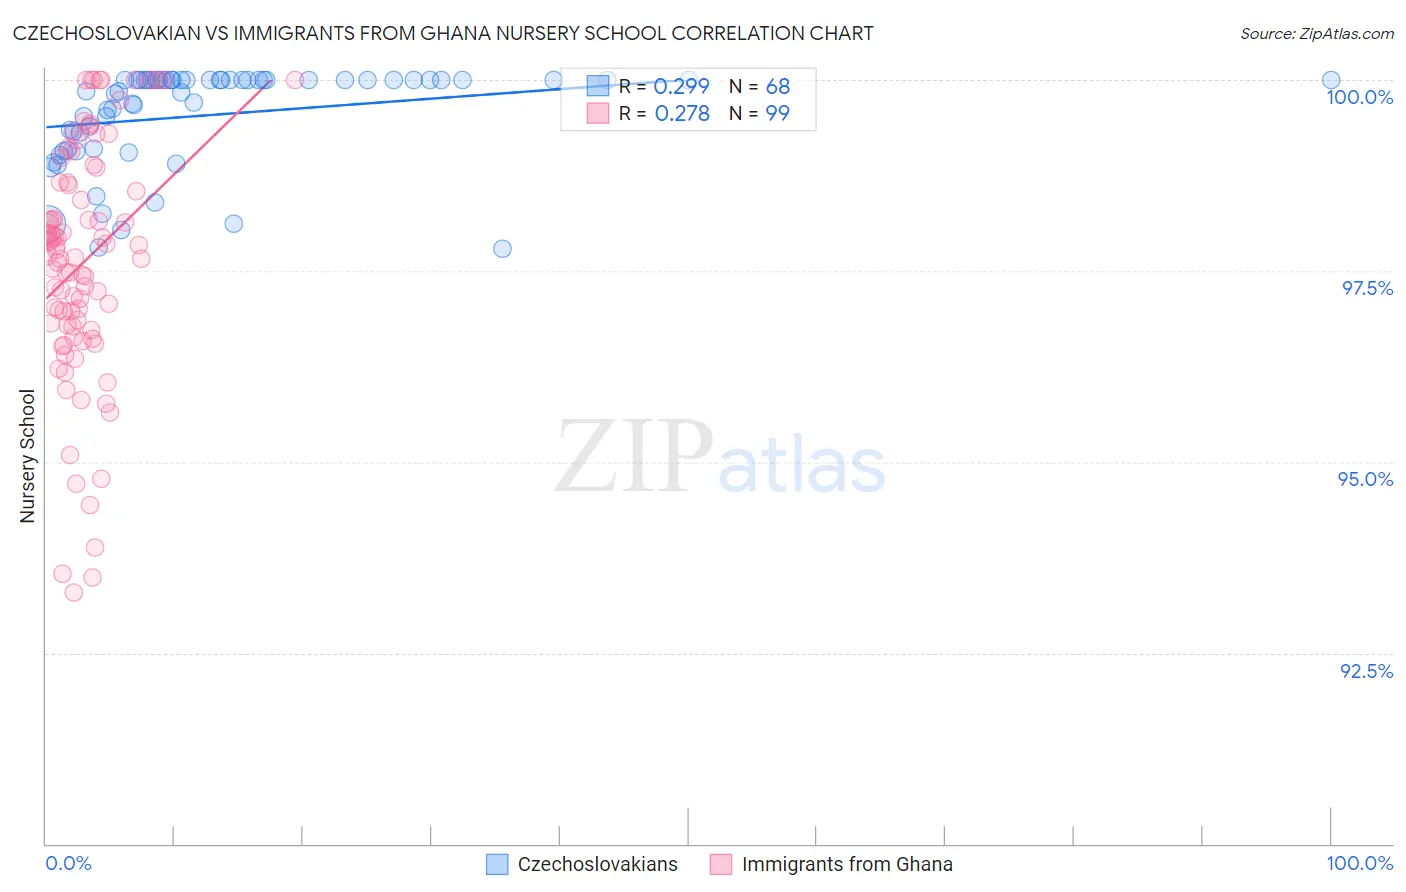
Czechoslovakian vs Immigrants from Ghana Nursery School Correlation Chart
The statistical analysis conducted on geographies consisting of 368,666,701 people shows a weak positive correlation between the proportion of Czechoslovakians and percentage of population with at least nursery school education in the United States with a correlation coefficient (R) of 0.299 and weighted average of 98.5%. Similarly, the statistical analysis conducted on geographies consisting of 199,952,023 people shows a weak positive correlation between the proportion of Immigrants from Ghana and percentage of population with at least nursery school education in the United States with a correlation coefficient (R) of 0.278 and weighted average of 97.4%, a difference of 1.1%.
Nursery School Correlation Summary
| Measurement | Czechoslovakian | Immigrants from Ghana |
| Minimum | 97.8% | 93.3% |
| Maximum | 100.0% | 100.0% |
| Range | 2.2% | 6.7% |
| Mean | 99.5% | 97.6% |
| Median | 100.0% | 97.7% |
| Interquartile 25% (IQ1) | 99.1% | 96.8% |
| Interquartile 75% (IQ3) | 100.0% | 98.7% |
| Interquartile Range (IQR) | 0.90% | 1.9% |
| Standard Deviation (Sample) | 0.64% | 1.5% |
| Standard Deviation (Population) | 0.64% | 1.5% |
Similar Demographics by Nursery School
Demographics Similar to Czechoslovakians by Nursery School
In terms of nursery school, the demographic groups most similar to Czechoslovakians are Ottawa (98.5%, a difference of 0.010%), White/Caucasian (98.5%, a difference of 0.010%), Celtic (98.5%, a difference of 0.010%), Estonian (98.5%, a difference of 0.010%), and Australian (98.5%, a difference of 0.010%).
| Demographics | Rating | Rank | Nursery School |
| Chippewa | 99.9 /100 | #40 | Exceptional 98.5% |
| Luxembourgers | 99.9 /100 | #41 | Exceptional 98.5% |
| Eastern Europeans | 99.9 /100 | #42 | Exceptional 98.5% |
| Native Hawaiians | 99.9 /100 | #43 | Exceptional 98.5% |
| Belgians | 99.9 /100 | #44 | Exceptional 98.5% |
| Northern Europeans | 99.9 /100 | #45 | Exceptional 98.5% |
| Hungarians | 99.9 /100 | #46 | Exceptional 98.5% |
| Czechoslovakians | 99.9 /100 | #47 | Exceptional 98.5% |
| Ottawa | 99.8 /100 | #48 | Exceptional 98.5% |
| Whites/Caucasians | 99.8 /100 | #49 | Exceptional 98.5% |
| Celtics | 99.8 /100 | #50 | Exceptional 98.5% |
| Estonians | 99.8 /100 | #51 | Exceptional 98.5% |
| Australians | 99.8 /100 | #52 | Exceptional 98.5% |
| Kiowa | 99.8 /100 | #53 | Exceptional 98.4% |
| Pueblo | 99.8 /100 | #54 | Exceptional 98.4% |
Demographics Similar to Immigrants from Ghana by Nursery School
In terms of nursery school, the demographic groups most similar to Immigrants from Ghana are Barbadian (97.4%, a difference of 0.0%), Trinidadian and Tobagonian (97.4%, a difference of 0.0%), Immigrants from Uzbekistan (97.4%, a difference of 0.010%), Afghan (97.4%, a difference of 0.010%), and Immigrants from Western Africa (97.4%, a difference of 0.020%).
| Demographics | Rating | Rank | Nursery School |
| Immigrants | Bolivia | 0.1 /100 | #272 | Tragic 97.5% |
| Immigrants | China | 0.1 /100 | #273 | Tragic 97.5% |
| Immigrants | Cameroon | 0.1 /100 | #274 | Tragic 97.5% |
| Ghanaians | 0.1 /100 | #275 | Tragic 97.5% |
| Immigrants | Philippines | 0.1 /100 | #276 | Tragic 97.5% |
| Immigrants | Western Africa | 0.1 /100 | #277 | Tragic 97.4% |
| Immigrants | Uzbekistan | 0.1 /100 | #278 | Tragic 97.4% |
| Immigrants | Ghana | 0.1 /100 | #279 | Tragic 97.4% |
| Barbadians | 0.0 /100 | #280 | Tragic 97.4% |
| Trinidadians and Tobagonians | 0.0 /100 | #281 | Tragic 97.4% |
| Afghans | 0.0 /100 | #282 | Tragic 97.4% |
| Immigrants | West Indies | 0.0 /100 | #283 | Tragic 97.4% |
| Immigrants | Trinidad and Tobago | 0.0 /100 | #284 | Tragic 97.4% |
| Immigrants | Barbados | 0.0 /100 | #285 | Tragic 97.4% |
| Immigrants | Portugal | 0.0 /100 | #286 | Tragic 97.4% |