Assyrian/Chaldean/Syriac vs Celtic Nursery School
COMPARE
Assyrian/Chaldean/Syriac
Celtic
Nursery School
Nursery School Comparison
Assyrians/Chaldeans/Syriacs
Celtics
97.6%
NURSERY SCHOOL
0.3/ 100
METRIC RATING
265th/ 347
METRIC RANK
98.5%
NURSERY SCHOOL
99.8/ 100
METRIC RATING
50th/ 347
METRIC RANK
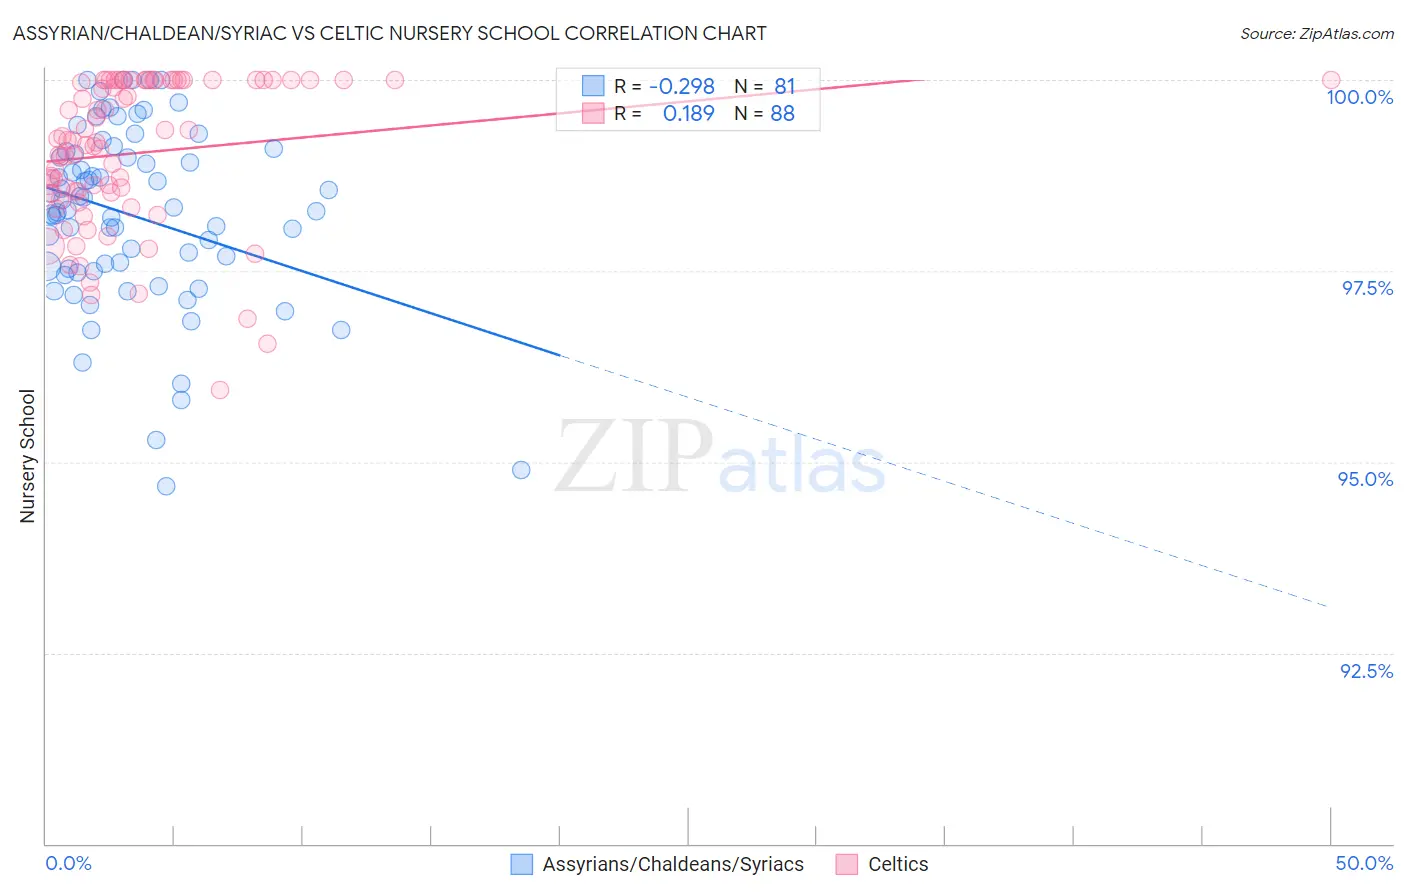
Assyrian/Chaldean/Syriac vs Celtic Nursery School Correlation Chart
The statistical analysis conducted on geographies consisting of 110,318,304 people shows a weak negative correlation between the proportion of Assyrians/Chaldeans/Syriacs and percentage of population with at least nursery school education in the United States with a correlation coefficient (R) of -0.298 and weighted average of 97.6%. Similarly, the statistical analysis conducted on geographies consisting of 168,875,705 people shows a poor positive correlation between the proportion of Celtics and percentage of population with at least nursery school education in the United States with a correlation coefficient (R) of 0.189 and weighted average of 98.5%, a difference of 0.91%.
Nursery School Correlation Summary
| Measurement | Assyrian/Chaldean/Syriac | Celtic |
| Minimum | 94.7% | 95.9% |
| Maximum | 100.0% | 100.0% |
| Range | 5.3% | 4.1% |
| Mean | 98.2% | 99.0% |
| Median | 98.3% | 99.2% |
| Interquartile 25% (IQ1) | 97.5% | 98.5% |
| Interquartile 75% (IQ3) | 99.1% | 100.0% |
| Interquartile Range (IQR) | 1.5% | 1.5% |
| Standard Deviation (Sample) | 1.2% | 0.96% |
| Standard Deviation (Population) | 1.2% | 0.95% |
Similar Demographics by Nursery School
Demographics Similar to Assyrians/Chaldeans/Syriacs by Nursery School
In terms of nursery school, the demographic groups most similar to Assyrians/Chaldeans/Syriacs are Fijian (97.6%, a difference of 0.0%), Taiwanese (97.6%, a difference of 0.0%), Immigrants from South America (97.6%, a difference of 0.010%), Cuban (97.6%, a difference of 0.010%), and Immigrants from Ethiopia (97.6%, a difference of 0.010%).
| Demographics | Rating | Rank | Nursery School |
| Jamaicans | 0.6 /100 | #258 | Tragic 97.6% |
| Armenians | 0.4 /100 | #259 | Tragic 97.6% |
| Immigrants | South America | 0.4 /100 | #260 | Tragic 97.6% |
| Cubans | 0.4 /100 | #261 | Tragic 97.6% |
| Immigrants | Ethiopia | 0.4 /100 | #262 | Tragic 97.6% |
| Fijians | 0.3 /100 | #263 | Tragic 97.6% |
| Taiwanese | 0.3 /100 | #264 | Tragic 97.6% |
| Assyrians/Chaldeans/Syriacs | 0.3 /100 | #265 | Tragic 97.6% |
| Immigrants | Sierra Leone | 0.3 /100 | #266 | Tragic 97.6% |
| Immigrants | Nigeria | 0.3 /100 | #267 | Tragic 97.5% |
| West Indians | 0.3 /100 | #268 | Tragic 97.5% |
| Immigrants | Liberia | 0.3 /100 | #269 | Tragic 97.5% |
| Immigrants | Jamaica | 0.2 /100 | #270 | Tragic 97.5% |
| Immigrants | Peru | 0.2 /100 | #271 | Tragic 97.5% |
| Immigrants | Bolivia | 0.1 /100 | #272 | Tragic 97.5% |
Demographics Similar to Celtics by Nursery School
In terms of nursery school, the demographic groups most similar to Celtics are Ottawa (98.5%, a difference of 0.0%), White/Caucasian (98.5%, a difference of 0.0%), Estonian (98.5%, a difference of 0.0%), Australian (98.5%, a difference of 0.0%), and Czechoslovakian (98.5%, a difference of 0.010%).
| Demographics | Rating | Rank | Nursery School |
| Native Hawaiians | 99.9 /100 | #43 | Exceptional 98.5% |
| Belgians | 99.9 /100 | #44 | Exceptional 98.5% |
| Northern Europeans | 99.9 /100 | #45 | Exceptional 98.5% |
| Hungarians | 99.9 /100 | #46 | Exceptional 98.5% |
| Czechoslovakians | 99.9 /100 | #47 | Exceptional 98.5% |
| Ottawa | 99.8 /100 | #48 | Exceptional 98.5% |
| Whites/Caucasians | 99.8 /100 | #49 | Exceptional 98.5% |
| Celtics | 99.8 /100 | #50 | Exceptional 98.5% |
| Estonians | 99.8 /100 | #51 | Exceptional 98.5% |
| Australians | 99.8 /100 | #52 | Exceptional 98.5% |
| Kiowa | 99.8 /100 | #53 | Exceptional 98.4% |
| Pueblo | 99.8 /100 | #54 | Exceptional 98.4% |
| Immigrants | Scotland | 99.8 /100 | #55 | Exceptional 98.4% |
| Americans | 99.8 /100 | #56 | Exceptional 98.4% |
| Austrians | 99.8 /100 | #57 | Exceptional 98.4% |