Icelander vs Trinidadian and Tobagonian No Schooling Completed
COMPARE
Icelander
Trinidadian and Tobagonian
No Schooling Completed
No Schooling Completed Comparison
Icelanders
Trinidadians and Tobagonians
1.7%
NO SCHOOLING COMPLETED
99.3/ 100
METRIC RATING
81st/ 347
METRIC RANK
2.6%
NO SCHOOLING COMPLETED
0.1/ 100
METRIC RATING
280th/ 347
METRIC RANK
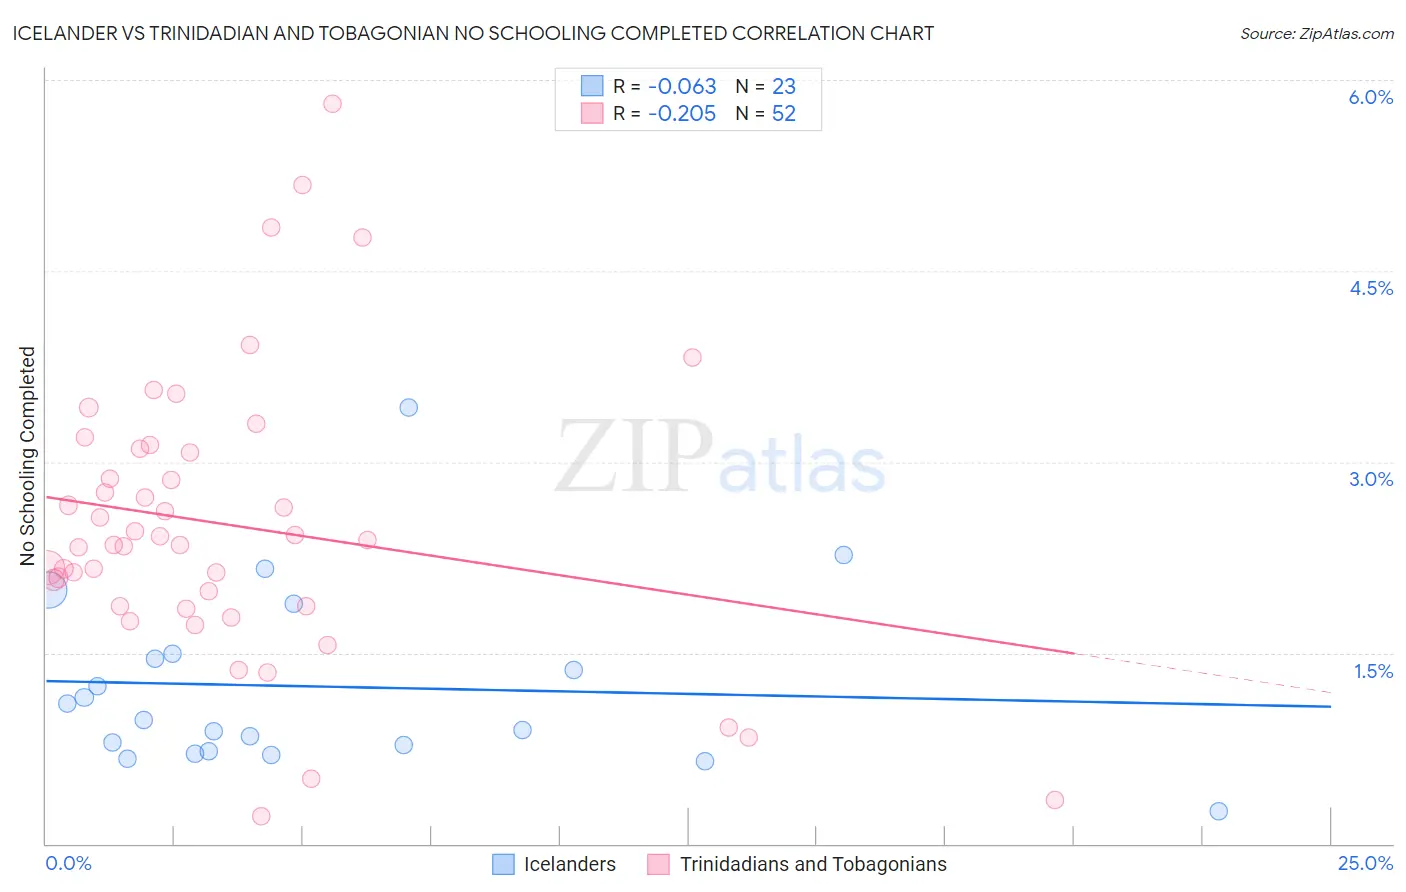
Icelander vs Trinidadian and Tobagonian No Schooling Completed Correlation Chart
The statistical analysis conducted on geographies consisting of 158,793,284 people shows a slight negative correlation between the proportion of Icelanders and percentage of population with no schooling in the United States with a correlation coefficient (R) of -0.063 and weighted average of 1.7%. Similarly, the statistical analysis conducted on geographies consisting of 219,048,767 people shows a weak negative correlation between the proportion of Trinidadians and Tobagonians and percentage of population with no schooling in the United States with a correlation coefficient (R) of -0.205 and weighted average of 2.6%, a difference of 48.9%.
No Schooling Completed Correlation Summary
| Measurement | Icelander | Trinidadian and Tobagonian |
| Minimum | 0.25% | 0.22% |
| Maximum | 3.4% | 5.8% |
| Range | 3.2% | 5.6% |
| Mean | 1.2% | 2.5% |
| Median | 0.97% | 2.4% |
| Interquartile 25% (IQ1) | 0.72% | 1.9% |
| Interquartile 75% (IQ3) | 1.5% | 3.1% |
| Interquartile Range (IQR) | 0.77% | 1.2% |
| Standard Deviation (Sample) | 0.71% | 1.1% |
| Standard Deviation (Population) | 0.70% | 1.1% |
Similar Demographics by No Schooling Completed
Demographics Similar to Icelanders by No Schooling Completed
In terms of no schooling completed, the demographic groups most similar to Icelanders are Cypriot (1.7%, a difference of 0.040%), Macedonian (1.7%, a difference of 0.050%), Immigrants from South Africa (1.7%, a difference of 0.090%), Delaware (1.7%, a difference of 0.13%), and Immigrants from Sweden (1.7%, a difference of 0.17%).
| Demographics | Rating | Rank | No Schooling Completed |
| Zimbabweans | 99.4 /100 | #74 | Exceptional 1.7% |
| Immigrants | Belgium | 99.3 /100 | #75 | Exceptional 1.7% |
| Cherokee | 99.3 /100 | #76 | Exceptional 1.7% |
| Immigrants | Sweden | 99.3 /100 | #77 | Exceptional 1.7% |
| Delaware | 99.3 /100 | #78 | Exceptional 1.7% |
| Macedonians | 99.3 /100 | #79 | Exceptional 1.7% |
| Cypriots | 99.3 /100 | #80 | Exceptional 1.7% |
| Icelanders | 99.3 /100 | #81 | Exceptional 1.7% |
| Immigrants | South Africa | 99.3 /100 | #82 | Exceptional 1.7% |
| Potawatomi | 99.3 /100 | #83 | Exceptional 1.7% |
| Immigrants | Denmark | 99.2 /100 | #84 | Exceptional 1.7% |
| Immigrants | Australia | 99.2 /100 | #85 | Exceptional 1.7% |
| Ukrainians | 99.2 /100 | #86 | Exceptional 1.8% |
| Osage | 99.2 /100 | #87 | Exceptional 1.8% |
| Immigrants | Western Europe | 99.2 /100 | #88 | Exceptional 1.8% |
Demographics Similar to Trinidadians and Tobagonians by No Schooling Completed
In terms of no schooling completed, the demographic groups most similar to Trinidadians and Tobagonians are Barbadian (2.6%, a difference of 0.020%), Afghan (2.6%, a difference of 0.080%), Immigrants from Ghana (2.6%, a difference of 0.28%), Immigrants from Uzbekistan (2.6%, a difference of 0.56%), and Immigrants from Philippines (2.6%, a difference of 0.76%).
| Demographics | Rating | Rank | No Schooling Completed |
| Immigrants | Cameroon | 0.1 /100 | #273 | Tragic 2.5% |
| Ghanaians | 0.1 /100 | #274 | Tragic 2.6% |
| Immigrants | China | 0.1 /100 | #275 | Tragic 2.6% |
| Immigrants | Western Africa | 0.1 /100 | #276 | Tragic 2.6% |
| Immigrants | Philippines | 0.1 /100 | #277 | Tragic 2.6% |
| Immigrants | Uzbekistan | 0.1 /100 | #278 | Tragic 2.6% |
| Barbadians | 0.1 /100 | #279 | Tragic 2.6% |
| Trinidadians and Tobagonians | 0.1 /100 | #280 | Tragic 2.6% |
| Afghans | 0.1 /100 | #281 | Tragic 2.6% |
| Immigrants | Ghana | 0.1 /100 | #282 | Tragic 2.6% |
| Immigrants | Trinidad and Tobago | 0.0 /100 | #283 | Tragic 2.6% |
| Immigrants | West Indies | 0.0 /100 | #284 | Tragic 2.7% |
| Immigrants | Barbados | 0.0 /100 | #285 | Tragic 2.7% |
| Immigrants | Portugal | 0.0 /100 | #286 | Tragic 2.7% |
| Immigrants | Afghanistan | 0.0 /100 | #287 | Tragic 2.7% |