Icelander vs Immigrants from Grenada No Schooling Completed
COMPARE
Icelander
Immigrants from Grenada
No Schooling Completed
No Schooling Completed Comparison
Icelanders
Immigrants from Grenada
1.7%
NO SCHOOLING COMPLETED
99.3/ 100
METRIC RATING
81st/ 347
METRIC RANK
2.8%
NO SCHOOLING COMPLETED
0.0/ 100
METRIC RATING
292nd/ 347
METRIC RANK
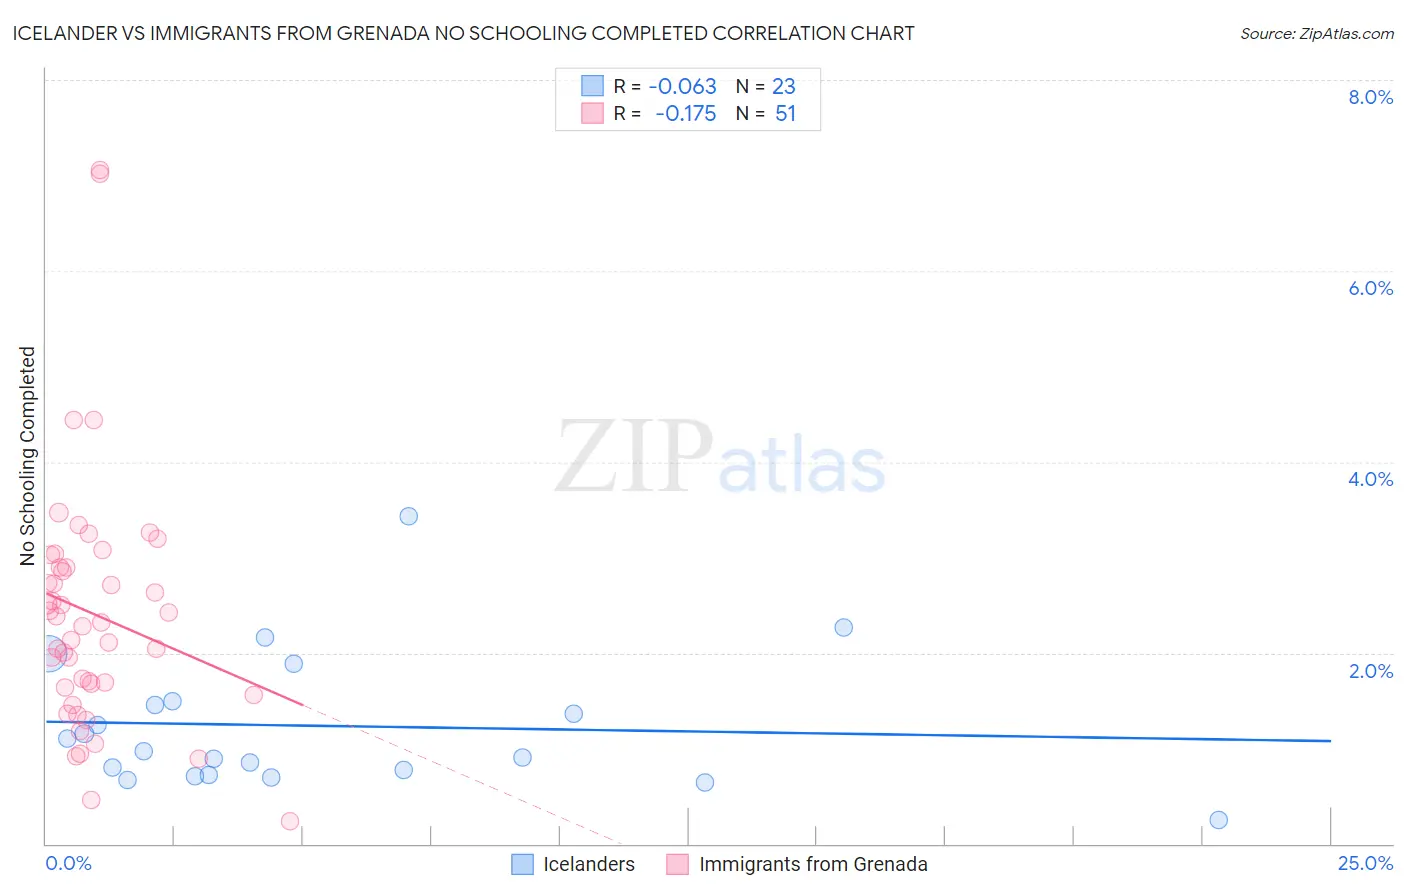
Icelander vs Immigrants from Grenada No Schooling Completed Correlation Chart
The statistical analysis conducted on geographies consisting of 158,793,284 people shows a slight negative correlation between the proportion of Icelanders and percentage of population with no schooling in the United States with a correlation coefficient (R) of -0.063 and weighted average of 1.7%. Similarly, the statistical analysis conducted on geographies consisting of 67,145,019 people shows a poor negative correlation between the proportion of Immigrants from Grenada and percentage of population with no schooling in the United States with a correlation coefficient (R) of -0.175 and weighted average of 2.8%, a difference of 58.0%.
No Schooling Completed Correlation Summary
| Measurement | Icelander | Immigrants from Grenada |
| Minimum | 0.25% | 0.24% |
| Maximum | 3.4% | 7.1% |
| Range | 3.2% | 6.8% |
| Mean | 1.2% | 2.4% |
| Median | 0.97% | 2.3% |
| Interquartile 25% (IQ1) | 0.72% | 1.6% |
| Interquartile 75% (IQ3) | 1.5% | 2.9% |
| Interquartile Range (IQR) | 0.77% | 1.3% |
| Standard Deviation (Sample) | 0.71% | 1.3% |
| Standard Deviation (Population) | 0.70% | 1.3% |
Similar Demographics by No Schooling Completed
Demographics Similar to Icelanders by No Schooling Completed
In terms of no schooling completed, the demographic groups most similar to Icelanders are Cypriot (1.7%, a difference of 0.040%), Macedonian (1.7%, a difference of 0.050%), Immigrants from South Africa (1.7%, a difference of 0.090%), Delaware (1.7%, a difference of 0.13%), and Immigrants from Sweden (1.7%, a difference of 0.17%).
| Demographics | Rating | Rank | No Schooling Completed |
| Zimbabweans | 99.4 /100 | #74 | Exceptional 1.7% |
| Immigrants | Belgium | 99.3 /100 | #75 | Exceptional 1.7% |
| Cherokee | 99.3 /100 | #76 | Exceptional 1.7% |
| Immigrants | Sweden | 99.3 /100 | #77 | Exceptional 1.7% |
| Delaware | 99.3 /100 | #78 | Exceptional 1.7% |
| Macedonians | 99.3 /100 | #79 | Exceptional 1.7% |
| Cypriots | 99.3 /100 | #80 | Exceptional 1.7% |
| Icelanders | 99.3 /100 | #81 | Exceptional 1.7% |
| Immigrants | South Africa | 99.3 /100 | #82 | Exceptional 1.7% |
| Potawatomi | 99.3 /100 | #83 | Exceptional 1.7% |
| Immigrants | Denmark | 99.2 /100 | #84 | Exceptional 1.7% |
| Immigrants | Australia | 99.2 /100 | #85 | Exceptional 1.7% |
| Ukrainians | 99.2 /100 | #86 | Exceptional 1.8% |
| Osage | 99.2 /100 | #87 | Exceptional 1.8% |
| Immigrants | Western Europe | 99.2 /100 | #88 | Exceptional 1.8% |
Demographics Similar to Immigrants from Grenada by No Schooling Completed
In terms of no schooling completed, the demographic groups most similar to Immigrants from Grenada are Malaysian (2.8%, a difference of 0.41%), Immigrants from Eritrea (2.8%, a difference of 0.58%), British West Indian (2.7%, a difference of 1.1%), Houma (2.8%, a difference of 1.1%), and Immigrants (2.8%, a difference of 1.2%).
| Demographics | Rating | Rank | No Schooling Completed |
| Immigrants | Barbados | 0.0 /100 | #285 | Tragic 2.7% |
| Immigrants | Portugal | 0.0 /100 | #286 | Tragic 2.7% |
| Immigrants | Afghanistan | 0.0 /100 | #287 | Tragic 2.7% |
| Immigrants | St. Vincent and the Grenadines | 0.0 /100 | #288 | Tragic 2.7% |
| Immigrants | Thailand | 0.0 /100 | #289 | Tragic 2.7% |
| Immigrants | Hong Kong | 0.0 /100 | #290 | Tragic 2.7% |
| British West Indians | 0.0 /100 | #291 | Tragic 2.7% |
| Immigrants | Grenada | 0.0 /100 | #292 | Tragic 2.8% |
| Malaysians | 0.0 /100 | #293 | Tragic 2.8% |
| Immigrants | Eritrea | 0.0 /100 | #294 | Tragic 2.8% |
| Houma | 0.0 /100 | #295 | Tragic 2.8% |
| Immigrants | Immigrants | 0.0 /100 | #296 | Tragic 2.8% |
| Immigrants | Cuba | 0.0 /100 | #297 | Tragic 2.8% |
| Immigrants | Dominica | 0.0 /100 | #298 | Tragic 2.8% |
| Central American Indians | 0.0 /100 | #299 | Tragic 2.8% |