West Indian vs Trinidadian and Tobagonian No Schooling Completed
COMPARE
West Indian
Trinidadian and Tobagonian
No Schooling Completed
No Schooling Completed Comparison
West Indians
Trinidadians and Tobagonians
2.5%
NO SCHOOLING COMPLETED
0.4/ 100
METRIC RATING
265th/ 347
METRIC RANK
2.6%
NO SCHOOLING COMPLETED
0.1/ 100
METRIC RATING
280th/ 347
METRIC RANK
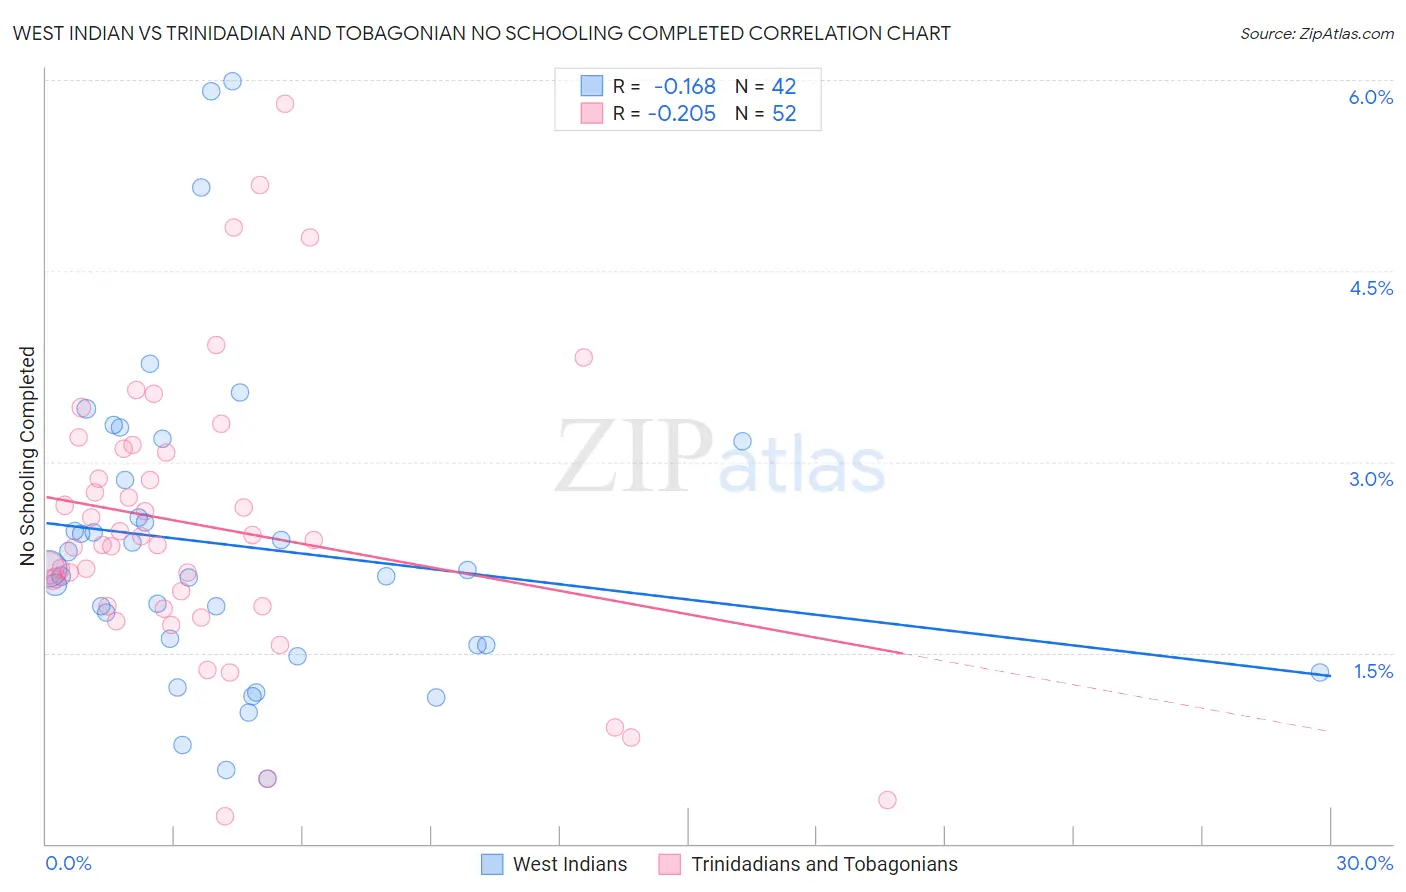
West Indian vs Trinidadian and Tobagonian No Schooling Completed Correlation Chart
The statistical analysis conducted on geographies consisting of 253,089,115 people shows a poor negative correlation between the proportion of West Indians and percentage of population with no schooling in the United States with a correlation coefficient (R) of -0.168 and weighted average of 2.5%. Similarly, the statistical analysis conducted on geographies consisting of 219,048,767 people shows a weak negative correlation between the proportion of Trinidadians and Tobagonians and percentage of population with no schooling in the United States with a correlation coefficient (R) of -0.205 and weighted average of 2.6%, a difference of 4.8%.
No Schooling Completed Correlation Summary
| Measurement | West Indian | Trinidadian and Tobagonian |
| Minimum | 0.51% | 0.22% |
| Maximum | 6.0% | 5.8% |
| Range | 5.5% | 5.6% |
| Mean | 2.3% | 2.5% |
| Median | 2.1% | 2.4% |
| Interquartile 25% (IQ1) | 1.6% | 1.9% |
| Interquartile 75% (IQ3) | 2.9% | 3.1% |
| Interquartile Range (IQR) | 1.3% | 1.2% |
| Standard Deviation (Sample) | 1.2% | 1.1% |
| Standard Deviation (Population) | 1.2% | 1.1% |
Demographics Similar to West Indians and Trinidadians and Tobagonians by No Schooling Completed
In terms of no schooling completed, the demographic groups most similar to West Indians are Fijian (2.5%, a difference of 0.080%), Indian (Asian) (2.5%, a difference of 0.18%), Yuman (2.5%, a difference of 0.25%), Immigrants from Liberia (2.5%, a difference of 0.31%), and Immigrants from Sierra Leone (2.5%, a difference of 0.48%). Similarly, the demographic groups most similar to Trinidadians and Tobagonians are Barbadian (2.6%, a difference of 0.020%), Afghan (2.6%, a difference of 0.080%), Immigrants from Ghana (2.6%, a difference of 0.28%), Immigrants from Uzbekistan (2.6%, a difference of 0.56%), and Immigrants from Philippines (2.6%, a difference of 0.76%).
| Demographics | Rating | Rank | No Schooling Completed |
| Immigrants | Sierra Leone | 0.5 /100 | #262 | Tragic 2.5% |
| Immigrants | Liberia | 0.4 /100 | #263 | Tragic 2.5% |
| Indians (Asian) | 0.4 /100 | #264 | Tragic 2.5% |
| West Indians | 0.4 /100 | #265 | Tragic 2.5% |
| Fijians | 0.4 /100 | #266 | Tragic 2.5% |
| Yuman | 0.4 /100 | #267 | Tragic 2.5% |
| Taiwanese | 0.3 /100 | #268 | Tragic 2.5% |
| Immigrants | Nigeria | 0.2 /100 | #269 | Tragic 2.5% |
| Immigrants | Peru | 0.2 /100 | #270 | Tragic 2.5% |
| Cubans | 0.2 /100 | #271 | Tragic 2.5% |
| Immigrants | Bolivia | 0.2 /100 | #272 | Tragic 2.5% |
| Immigrants | Cameroon | 0.1 /100 | #273 | Tragic 2.5% |
| Ghanaians | 0.1 /100 | #274 | Tragic 2.6% |
| Immigrants | China | 0.1 /100 | #275 | Tragic 2.6% |
| Immigrants | Western Africa | 0.1 /100 | #276 | Tragic 2.6% |
| Immigrants | Philippines | 0.1 /100 | #277 | Tragic 2.6% |
| Immigrants | Uzbekistan | 0.1 /100 | #278 | Tragic 2.6% |
| Barbadians | 0.1 /100 | #279 | Tragic 2.6% |
| Trinidadians and Tobagonians | 0.1 /100 | #280 | Tragic 2.6% |
| Afghans | 0.1 /100 | #281 | Tragic 2.6% |
| Immigrants | Ghana | 0.1 /100 | #282 | Tragic 2.6% |