Icelander vs Immigrants from St. Vincent and the Grenadines No Schooling Completed
COMPARE
Icelander
Immigrants from St. Vincent and the Grenadines
No Schooling Completed
No Schooling Completed Comparison
Icelanders
Immigrants from St. Vincent and the Grenadines
1.7%
NO SCHOOLING COMPLETED
99.3/ 100
METRIC RATING
81st/ 347
METRIC RANK
2.7%
NO SCHOOLING COMPLETED
0.0/ 100
METRIC RATING
288th/ 347
METRIC RANK
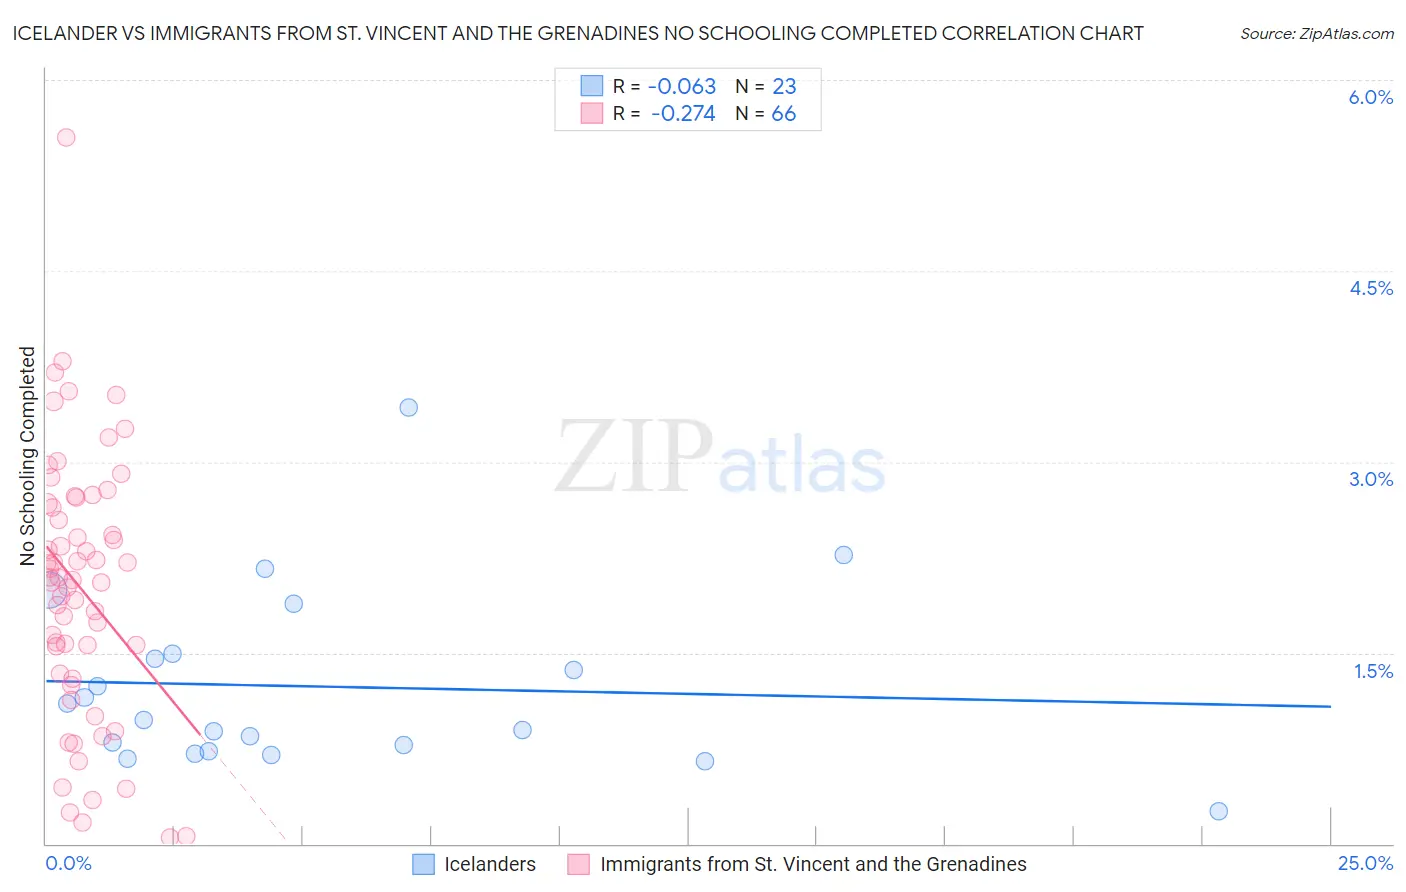
Icelander vs Immigrants from St. Vincent and the Grenadines No Schooling Completed Correlation Chart
The statistical analysis conducted on geographies consisting of 158,793,284 people shows a slight negative correlation between the proportion of Icelanders and percentage of population with no schooling in the United States with a correlation coefficient (R) of -0.063 and weighted average of 1.7%. Similarly, the statistical analysis conducted on geographies consisting of 56,079,309 people shows a weak negative correlation between the proportion of Immigrants from St. Vincent and the Grenadines and percentage of population with no schooling in the United States with a correlation coefficient (R) of -0.274 and weighted average of 2.7%, a difference of 54.3%.
No Schooling Completed Correlation Summary
| Measurement | Icelander | Immigrants from St. Vincent and the Grenadines |
| Minimum | 0.25% | 0.050% |
| Maximum | 3.4% | 5.6% |
| Range | 3.2% | 5.5% |
| Mean | 1.2% | 2.0% |
| Median | 0.97% | 2.1% |
| Interquartile 25% (IQ1) | 0.72% | 1.3% |
| Interquartile 75% (IQ3) | 1.5% | 2.7% |
| Interquartile Range (IQR) | 0.77% | 1.3% |
| Standard Deviation (Sample) | 0.71% | 1.0% |
| Standard Deviation (Population) | 0.70% | 1.0% |
Similar Demographics by No Schooling Completed
Demographics Similar to Icelanders by No Schooling Completed
In terms of no schooling completed, the demographic groups most similar to Icelanders are Cypriot (1.7%, a difference of 0.040%), Macedonian (1.7%, a difference of 0.050%), Immigrants from South Africa (1.7%, a difference of 0.090%), Delaware (1.7%, a difference of 0.13%), and Immigrants from Sweden (1.7%, a difference of 0.17%).
| Demographics | Rating | Rank | No Schooling Completed |
| Zimbabweans | 99.4 /100 | #74 | Exceptional 1.7% |
| Immigrants | Belgium | 99.3 /100 | #75 | Exceptional 1.7% |
| Cherokee | 99.3 /100 | #76 | Exceptional 1.7% |
| Immigrants | Sweden | 99.3 /100 | #77 | Exceptional 1.7% |
| Delaware | 99.3 /100 | #78 | Exceptional 1.7% |
| Macedonians | 99.3 /100 | #79 | Exceptional 1.7% |
| Cypriots | 99.3 /100 | #80 | Exceptional 1.7% |
| Icelanders | 99.3 /100 | #81 | Exceptional 1.7% |
| Immigrants | South Africa | 99.3 /100 | #82 | Exceptional 1.7% |
| Potawatomi | 99.3 /100 | #83 | Exceptional 1.7% |
| Immigrants | Denmark | 99.2 /100 | #84 | Exceptional 1.7% |
| Immigrants | Australia | 99.2 /100 | #85 | Exceptional 1.7% |
| Ukrainians | 99.2 /100 | #86 | Exceptional 1.8% |
| Osage | 99.2 /100 | #87 | Exceptional 1.8% |
| Immigrants | Western Europe | 99.2 /100 | #88 | Exceptional 1.8% |
Demographics Similar to Immigrants from St. Vincent and the Grenadines by No Schooling Completed
In terms of no schooling completed, the demographic groups most similar to Immigrants from St. Vincent and the Grenadines are Immigrants from Afghanistan (2.7%, a difference of 0.10%), Immigrants from Thailand (2.7%, a difference of 0.32%), Immigrants from Hong Kong (2.7%, a difference of 0.38%), Immigrants from Portugal (2.7%, a difference of 0.91%), and British West Indian (2.7%, a difference of 1.3%).
| Demographics | Rating | Rank | No Schooling Completed |
| Afghans | 0.1 /100 | #281 | Tragic 2.6% |
| Immigrants | Ghana | 0.1 /100 | #282 | Tragic 2.6% |
| Immigrants | Trinidad and Tobago | 0.0 /100 | #283 | Tragic 2.6% |
| Immigrants | West Indies | 0.0 /100 | #284 | Tragic 2.7% |
| Immigrants | Barbados | 0.0 /100 | #285 | Tragic 2.7% |
| Immigrants | Portugal | 0.0 /100 | #286 | Tragic 2.7% |
| Immigrants | Afghanistan | 0.0 /100 | #287 | Tragic 2.7% |
| Immigrants | St. Vincent and the Grenadines | 0.0 /100 | #288 | Tragic 2.7% |
| Immigrants | Thailand | 0.0 /100 | #289 | Tragic 2.7% |
| Immigrants | Hong Kong | 0.0 /100 | #290 | Tragic 2.7% |
| British West Indians | 0.0 /100 | #291 | Tragic 2.7% |
| Immigrants | Grenada | 0.0 /100 | #292 | Tragic 2.8% |
| Malaysians | 0.0 /100 | #293 | Tragic 2.8% |
| Immigrants | Eritrea | 0.0 /100 | #294 | Tragic 2.8% |
| Houma | 0.0 /100 | #295 | Tragic 2.8% |