Apache vs Trinidadian and Tobagonian No Schooling Completed
COMPARE
Apache
Trinidadian and Tobagonian
No Schooling Completed
No Schooling Completed Comparison
Apache
Trinidadians and Tobagonians
2.1%
NO SCHOOLING COMPLETED
56.7/ 100
METRIC RATING
169th/ 347
METRIC RANK
2.6%
NO SCHOOLING COMPLETED
0.1/ 100
METRIC RATING
280th/ 347
METRIC RANK
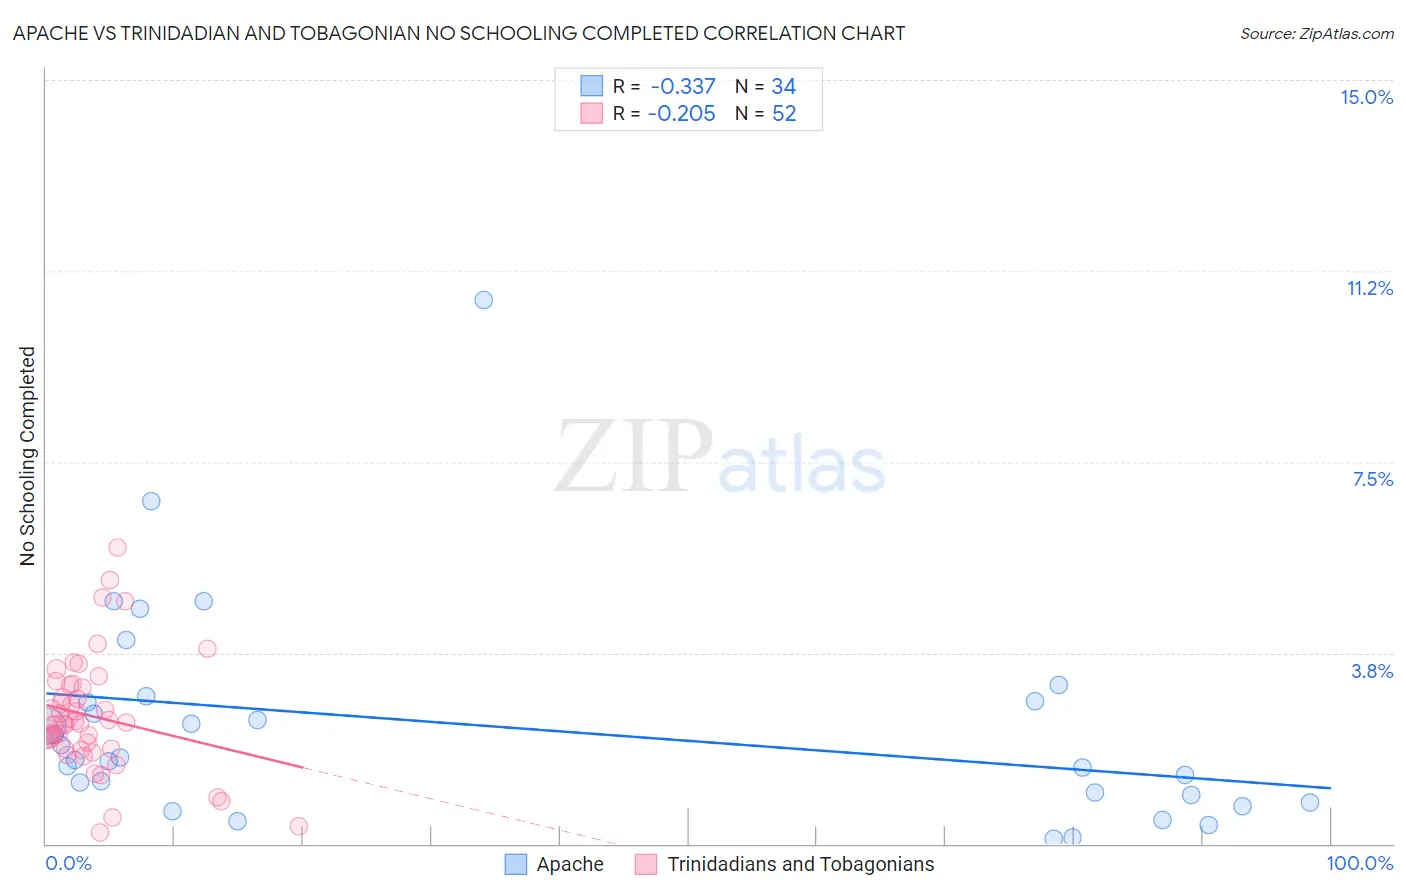
Apache vs Trinidadian and Tobagonian No Schooling Completed Correlation Chart
The statistical analysis conducted on geographies consisting of 229,858,613 people shows a mild negative correlation between the proportion of Apache and percentage of population with no schooling in the United States with a correlation coefficient (R) of -0.337 and weighted average of 2.1%. Similarly, the statistical analysis conducted on geographies consisting of 219,048,767 people shows a weak negative correlation between the proportion of Trinidadians and Tobagonians and percentage of population with no schooling in the United States with a correlation coefficient (R) of -0.205 and weighted average of 2.6%, a difference of 25.4%.
No Schooling Completed Correlation Summary
| Measurement | Apache | Trinidadian and Tobagonian |
| Minimum | 0.098% | 0.22% |
| Maximum | 10.7% | 5.8% |
| Range | 10.6% | 5.6% |
| Mean | 2.3% | 2.5% |
| Median | 1.7% | 2.4% |
| Interquartile 25% (IQ1) | 0.95% | 1.9% |
| Interquartile 75% (IQ3) | 2.8% | 3.1% |
| Interquartile Range (IQR) | 1.9% | 1.2% |
| Standard Deviation (Sample) | 2.1% | 1.1% |
| Standard Deviation (Population) | 2.1% | 1.1% |
Similar Demographics by No Schooling Completed
Demographics Similar to Apache by No Schooling Completed
In terms of no schooling completed, the demographic groups most similar to Apache are Argentinean (2.1%, a difference of 0.090%), Immigrants from Poland (2.1%, a difference of 0.20%), Cheyenne (2.1%, a difference of 0.27%), Egyptian (2.1%, a difference of 0.35%), and Dutch West Indian (2.1%, a difference of 0.46%).
| Demographics | Rating | Rank | No Schooling Completed |
| Immigrants | Brazil | 63.8 /100 | #162 | Good 2.1% |
| Albanians | 62.2 /100 | #163 | Good 2.1% |
| Comanche | 60.7 /100 | #164 | Good 2.1% |
| Brazilians | 60.2 /100 | #165 | Good 2.1% |
| Dutch West Indians | 59.9 /100 | #166 | Average 2.1% |
| Egyptians | 59.2 /100 | #167 | Average 2.1% |
| Cheyenne | 58.6 /100 | #168 | Average 2.1% |
| Apache | 56.7 /100 | #169 | Average 2.1% |
| Argentineans | 56.0 /100 | #170 | Average 2.1% |
| Immigrants | Poland | 55.2 /100 | #171 | Average 2.1% |
| Immigrants | Argentina | 52.7 /100 | #172 | Average 2.1% |
| Immigrants | Belarus | 51.8 /100 | #173 | Average 2.1% |
| Immigrants | Micronesia | 50.0 /100 | #174 | Average 2.1% |
| Arabs | 46.4 /100 | #175 | Average 2.1% |
| Panamanians | 45.2 /100 | #176 | Average 2.1% |
Demographics Similar to Trinidadians and Tobagonians by No Schooling Completed
In terms of no schooling completed, the demographic groups most similar to Trinidadians and Tobagonians are Barbadian (2.6%, a difference of 0.020%), Afghan (2.6%, a difference of 0.080%), Immigrants from Ghana (2.6%, a difference of 0.28%), Immigrants from Uzbekistan (2.6%, a difference of 0.56%), and Immigrants from Philippines (2.6%, a difference of 0.76%).
| Demographics | Rating | Rank | No Schooling Completed |
| Immigrants | Cameroon | 0.1 /100 | #273 | Tragic 2.5% |
| Ghanaians | 0.1 /100 | #274 | Tragic 2.6% |
| Immigrants | China | 0.1 /100 | #275 | Tragic 2.6% |
| Immigrants | Western Africa | 0.1 /100 | #276 | Tragic 2.6% |
| Immigrants | Philippines | 0.1 /100 | #277 | Tragic 2.6% |
| Immigrants | Uzbekistan | 0.1 /100 | #278 | Tragic 2.6% |
| Barbadians | 0.1 /100 | #279 | Tragic 2.6% |
| Trinidadians and Tobagonians | 0.1 /100 | #280 | Tragic 2.6% |
| Afghans | 0.1 /100 | #281 | Tragic 2.6% |
| Immigrants | Ghana | 0.1 /100 | #282 | Tragic 2.6% |
| Immigrants | Trinidad and Tobago | 0.0 /100 | #283 | Tragic 2.6% |
| Immigrants | West Indies | 0.0 /100 | #284 | Tragic 2.7% |
| Immigrants | Barbados | 0.0 /100 | #285 | Tragic 2.7% |
| Immigrants | Portugal | 0.0 /100 | #286 | Tragic 2.7% |
| Immigrants | Afghanistan | 0.0 /100 | #287 | Tragic 2.7% |