Icelander vs Trinidadian and Tobagonian In Labor Force | Age 25-29
COMPARE
Icelander
Trinidadian and Tobagonian
In Labor Force | Age 25-29
In Labor Force | Age 25-29 Comparison
Icelanders
Trinidadians and Tobagonians
84.8%
IN LABOR FORCE | AGE 25-29
68.2/ 100
METRIC RATING
146th/ 347
METRIC RANK
83.9%
IN LABOR FORCE | AGE 25-29
0.7/ 100
METRIC RATING
240th/ 347
METRIC RANK
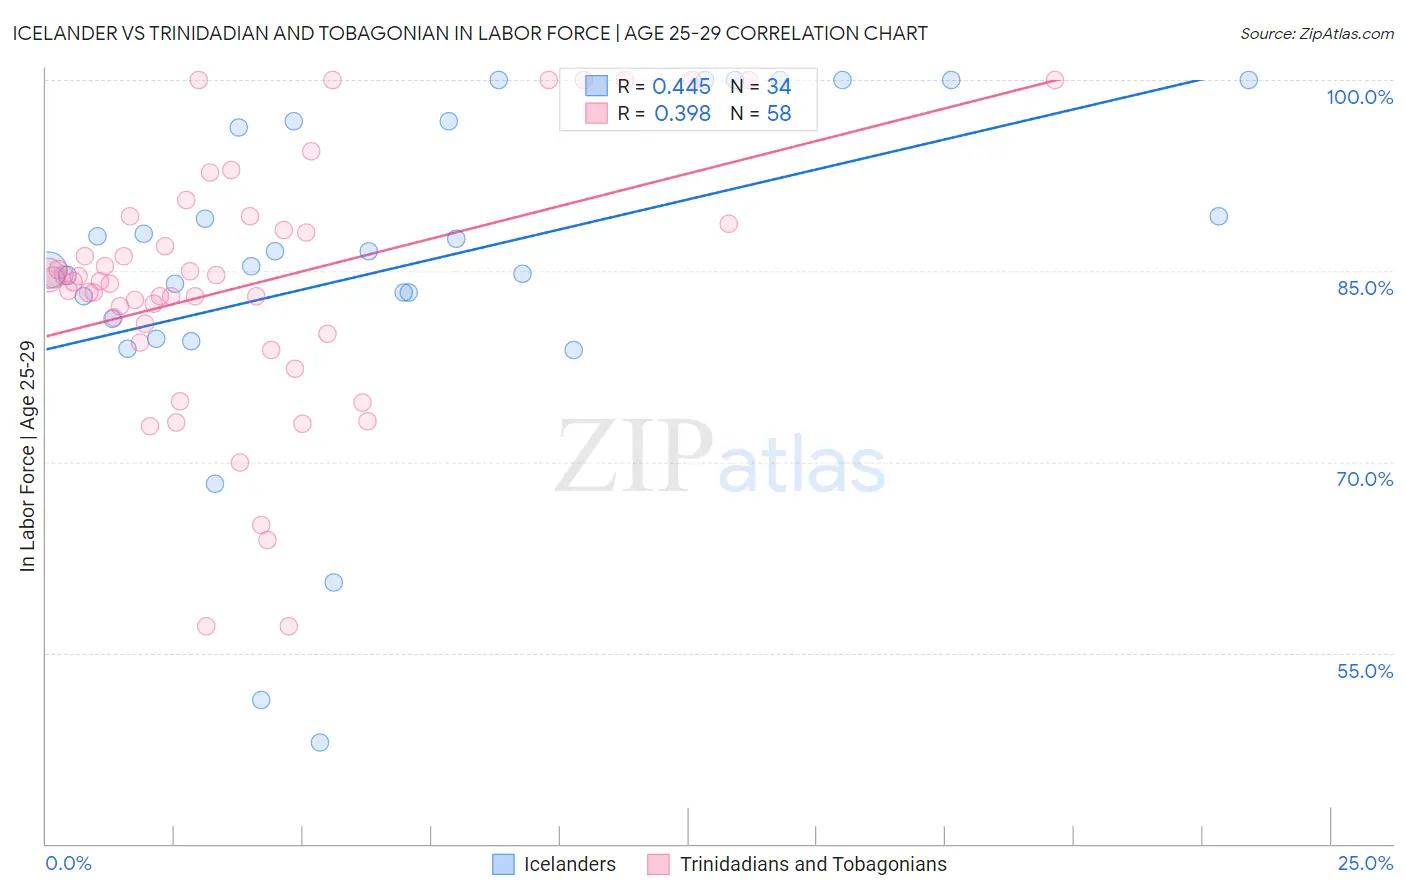
Icelander vs Trinidadian and Tobagonian In Labor Force | Age 25-29 Correlation Chart
The statistical analysis conducted on geographies consisting of 159,638,319 people shows a moderate positive correlation between the proportion of Icelanders and labor force participation rate among population between the ages 25 and 29 in the United States with a correlation coefficient (R) of 0.445 and weighted average of 84.8%. Similarly, the statistical analysis conducted on geographies consisting of 219,834,546 people shows a mild positive correlation between the proportion of Trinidadians and Tobagonians and labor force participation rate among population between the ages 25 and 29 in the United States with a correlation coefficient (R) of 0.398 and weighted average of 83.9%, a difference of 1.1%.
In Labor Force | Age 25-29 Correlation Summary
| Measurement | Icelander | Trinidadian and Tobagonian |
| Minimum | 48.0% | 57.1% |
| Maximum | 100.0% | 100.0% |
| Range | 52.0% | 42.9% |
| Mean | 85.4% | 83.9% |
| Median | 85.9% | 84.2% |
| Interquartile 25% (IQ1) | 81.2% | 80.1% |
| Interquartile 75% (IQ3) | 96.7% | 88.7% |
| Interquartile Range (IQR) | 15.5% | 8.6% |
| Standard Deviation (Sample) | 13.0% | 10.0% |
| Standard Deviation (Population) | 12.8% | 9.9% |
Similar Demographics by In Labor Force | Age 25-29
Demographics Similar to Icelanders by In Labor Force | Age 25-29
In terms of in labor force | age 25-29, the demographic groups most similar to Icelanders are Immigrants from Senegal (84.8%, a difference of 0.0%), Immigrants from Asia (84.8%, a difference of 0.0%), Sri Lankan (84.8%, a difference of 0.010%), Immigrants from Laos (84.8%, a difference of 0.010%), and Pakistani (84.8%, a difference of 0.020%).
| Demographics | Rating | Rank | In Labor Force | Age 25-29 |
| Immigrants | Eastern Asia | 72.6 /100 | #139 | Good 84.8% |
| Immigrants | North America | 72.1 /100 | #140 | Good 84.8% |
| Danes | 71.9 /100 | #141 | Good 84.8% |
| Pakistanis | 70.0 /100 | #142 | Good 84.8% |
| Sri Lankans | 69.2 /100 | #143 | Good 84.8% |
| Immigrants | Laos | 69.0 /100 | #144 | Good 84.8% |
| Immigrants | Senegal | 68.3 /100 | #145 | Good 84.8% |
| Icelanders | 68.2 /100 | #146 | Good 84.8% |
| Immigrants | Asia | 68.2 /100 | #147 | Good 84.8% |
| Immigrants | England | 65.2 /100 | #148 | Good 84.7% |
| Peruvians | 64.7 /100 | #149 | Good 84.7% |
| Swiss | 64.7 /100 | #150 | Good 84.7% |
| Colombians | 62.8 /100 | #151 | Good 84.7% |
| Immigrants | Pakistan | 62.7 /100 | #152 | Good 84.7% |
| Immigrants | Taiwan | 62.2 /100 | #153 | Good 84.7% |
Demographics Similar to Trinidadians and Tobagonians by In Labor Force | Age 25-29
In terms of in labor force | age 25-29, the demographic groups most similar to Trinidadians and Tobagonians are Jamaican (83.9%, a difference of 0.0%), Immigrants from Uzbekistan (83.9%, a difference of 0.010%), Alsatian (83.9%, a difference of 0.020%), Iraqi (83.9%, a difference of 0.040%), and Guamanian/Chamorro (83.9%, a difference of 0.040%).
| Demographics | Rating | Rank | In Labor Force | Age 25-29 |
| Immigrants | Western Asia | 2.7 /100 | #233 | Tragic 84.1% |
| Barbadians | 1.0 /100 | #234 | Tragic 83.9% |
| Iraqis | 0.9 /100 | #235 | Tragic 83.9% |
| Guamanians/Chamorros | 0.9 /100 | #236 | Tragic 83.9% |
| Immigrants | Immigrants | 0.9 /100 | #237 | Tragic 83.9% |
| Immigrants | Uzbekistan | 0.8 /100 | #238 | Tragic 83.9% |
| Jamaicans | 0.8 /100 | #239 | Tragic 83.9% |
| Trinidadians and Tobagonians | 0.7 /100 | #240 | Tragic 83.9% |
| Alsatians | 0.7 /100 | #241 | Tragic 83.9% |
| U.S. Virgin Islanders | 0.6 /100 | #242 | Tragic 83.8% |
| Salvadorans | 0.5 /100 | #243 | Tragic 83.8% |
| Immigrants | Jamaica | 0.4 /100 | #244 | Tragic 83.8% |
| Iroquois | 0.4 /100 | #245 | Tragic 83.8% |
| Cree | 0.3 /100 | #246 | Tragic 83.8% |
| Immigrants | El Salvador | 0.3 /100 | #247 | Tragic 83.7% |