Icelander vs Japanese No Schooling Completed
COMPARE
Icelander
Japanese
No Schooling Completed
No Schooling Completed Comparison
Icelanders
Japanese
1.7%
NO SCHOOLING COMPLETED
99.3/ 100
METRIC RATING
81st/ 347
METRIC RANK
3.3%
NO SCHOOLING COMPLETED
0.0/ 100
METRIC RATING
331st/ 347
METRIC RANK
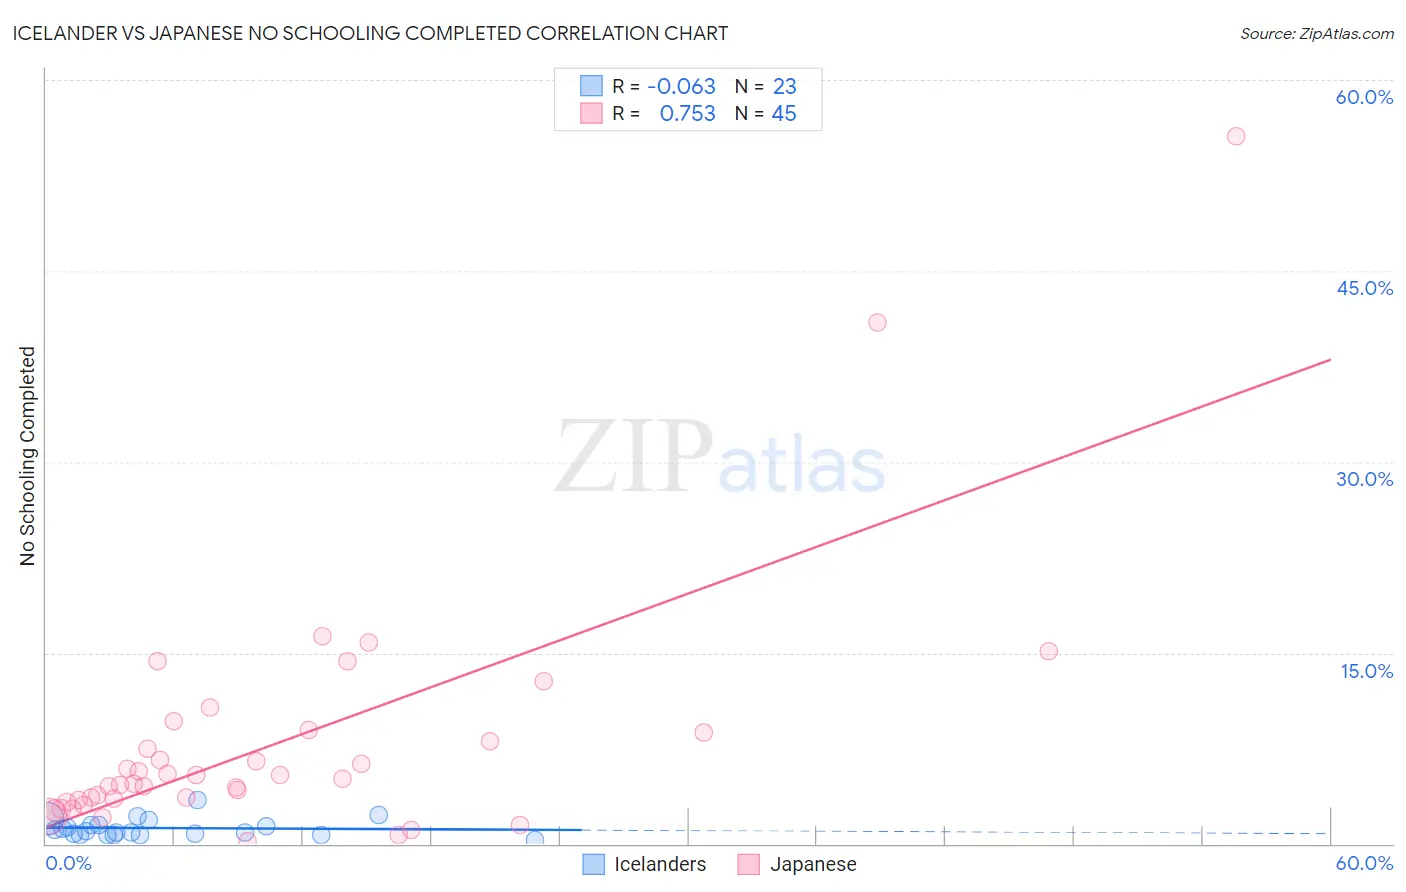
Icelander vs Japanese No Schooling Completed Correlation Chart
The statistical analysis conducted on geographies consisting of 158,793,284 people shows a slight negative correlation between the proportion of Icelanders and percentage of population with no schooling in the United States with a correlation coefficient (R) of -0.063 and weighted average of 1.7%. Similarly, the statistical analysis conducted on geographies consisting of 248,181,400 people shows a strong positive correlation between the proportion of Japanese and percentage of population with no schooling in the United States with a correlation coefficient (R) of 0.753 and weighted average of 3.3%, a difference of 91.8%.
No Schooling Completed Correlation Summary
| Measurement | Icelander | Japanese |
| Minimum | 0.25% | 0.20% |
| Maximum | 3.4% | 55.6% |
| Range | 3.2% | 55.4% |
| Mean | 1.2% | 8.0% |
| Median | 0.97% | 5.1% |
| Interquartile 25% (IQ1) | 0.72% | 3.3% |
| Interquartile 75% (IQ3) | 1.5% | 8.8% |
| Interquartile Range (IQR) | 0.77% | 5.5% |
| Standard Deviation (Sample) | 0.71% | 9.8% |
| Standard Deviation (Population) | 0.70% | 9.7% |
Similar Demographics by No Schooling Completed
Demographics Similar to Icelanders by No Schooling Completed
In terms of no schooling completed, the demographic groups most similar to Icelanders are Cypriot (1.7%, a difference of 0.040%), Macedonian (1.7%, a difference of 0.050%), Immigrants from South Africa (1.7%, a difference of 0.090%), Delaware (1.7%, a difference of 0.13%), and Immigrants from Sweden (1.7%, a difference of 0.17%).
| Demographics | Rating | Rank | No Schooling Completed |
| Zimbabweans | 99.4 /100 | #74 | Exceptional 1.7% |
| Immigrants | Belgium | 99.3 /100 | #75 | Exceptional 1.7% |
| Cherokee | 99.3 /100 | #76 | Exceptional 1.7% |
| Immigrants | Sweden | 99.3 /100 | #77 | Exceptional 1.7% |
| Delaware | 99.3 /100 | #78 | Exceptional 1.7% |
| Macedonians | 99.3 /100 | #79 | Exceptional 1.7% |
| Cypriots | 99.3 /100 | #80 | Exceptional 1.7% |
| Icelanders | 99.3 /100 | #81 | Exceptional 1.7% |
| Immigrants | South Africa | 99.3 /100 | #82 | Exceptional 1.7% |
| Potawatomi | 99.3 /100 | #83 | Exceptional 1.7% |
| Immigrants | Denmark | 99.2 /100 | #84 | Exceptional 1.7% |
| Immigrants | Australia | 99.2 /100 | #85 | Exceptional 1.7% |
| Ukrainians | 99.2 /100 | #86 | Exceptional 1.8% |
| Osage | 99.2 /100 | #87 | Exceptional 1.8% |
| Immigrants | Western Europe | 99.2 /100 | #88 | Exceptional 1.8% |
Demographics Similar to Japanese by No Schooling Completed
In terms of no schooling completed, the demographic groups most similar to Japanese are Immigrants from Armenia (3.3%, a difference of 0.030%), Immigrants from Vietnam (3.3%, a difference of 0.45%), Central American (3.4%, a difference of 1.5%), Mexican (3.3%, a difference of 1.5%), and Immigrants from Dominican Republic (3.4%, a difference of 1.6%).
| Demographics | Rating | Rank | No Schooling Completed |
| Mexican American Indians | 0.0 /100 | #324 | Tragic 3.2% |
| Dominicans | 0.0 /100 | #325 | Tragic 3.2% |
| Indonesians | 0.0 /100 | #326 | Tragic 3.2% |
| Immigrants | Latin America | 0.0 /100 | #327 | Tragic 3.3% |
| Mexicans | 0.0 /100 | #328 | Tragic 3.3% |
| Immigrants | Vietnam | 0.0 /100 | #329 | Tragic 3.3% |
| Immigrants | Armenia | 0.0 /100 | #330 | Tragic 3.3% |
| Japanese | 0.0 /100 | #331 | Tragic 3.3% |
| Central Americans | 0.0 /100 | #332 | Tragic 3.4% |
| Immigrants | Dominican Republic | 0.0 /100 | #333 | Tragic 3.4% |
| Guatemalans | 0.0 /100 | #334 | Tragic 3.5% |
| Immigrants | Cambodia | 0.0 /100 | #335 | Tragic 3.5% |
| Immigrants | Fiji | 0.0 /100 | #336 | Tragic 3.5% |
| Immigrants | Cabo Verde | 0.0 /100 | #337 | Tragic 3.5% |
| Bangladeshis | 0.0 /100 | #338 | Tragic 3.5% |