Icelander vs Filipino No Schooling Completed
COMPARE
Icelander
Filipino
No Schooling Completed
No Schooling Completed Comparison
Icelanders
Filipinos
1.7%
NO SCHOOLING COMPLETED
99.3/ 100
METRIC RATING
81st/ 347
METRIC RANK
2.0%
NO SCHOOLING COMPLETED
85.5/ 100
METRIC RATING
137th/ 347
METRIC RANK
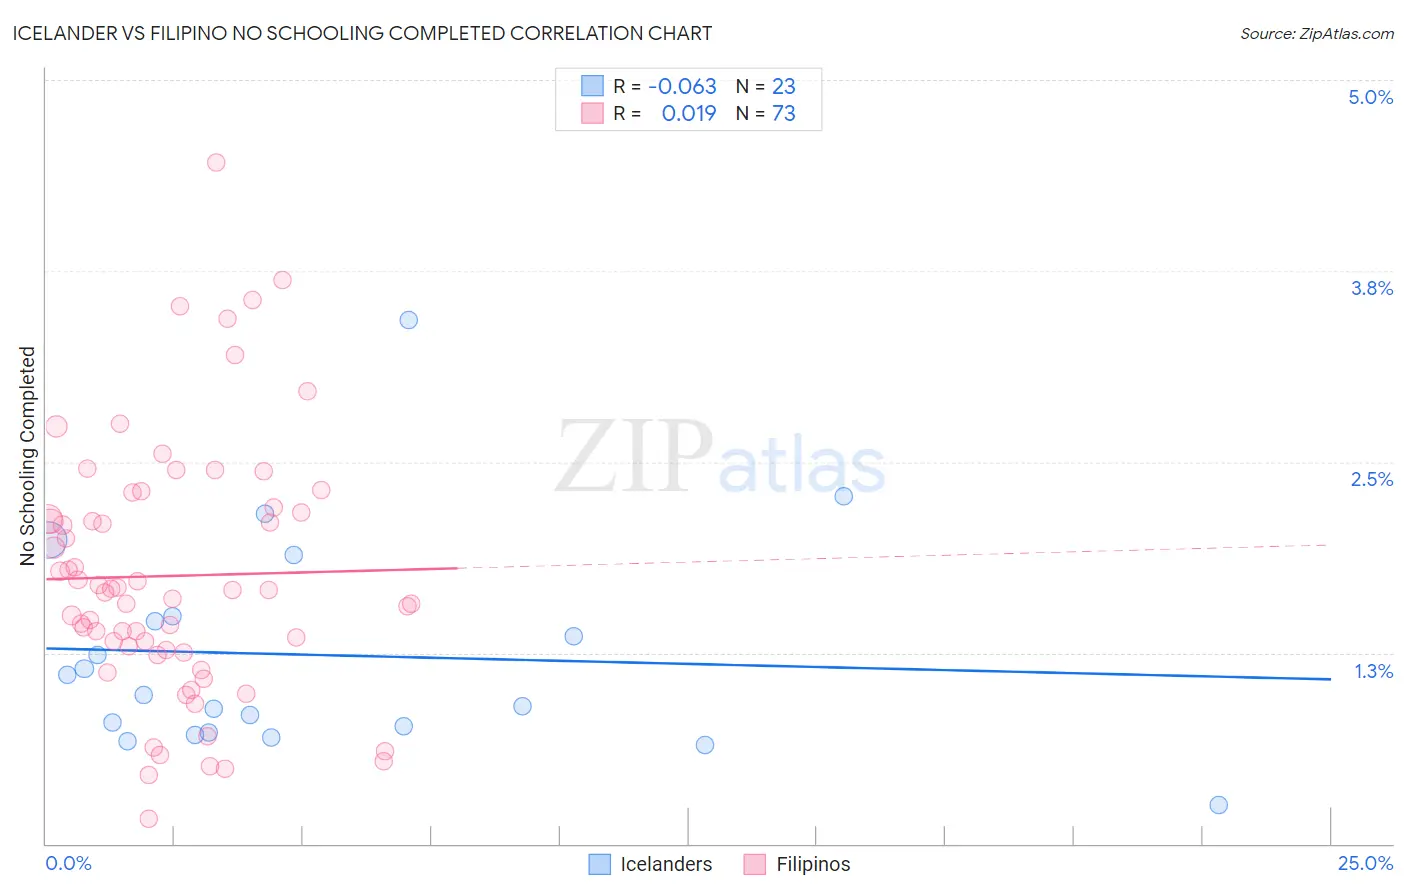
Icelander vs Filipino No Schooling Completed Correlation Chart
The statistical analysis conducted on geographies consisting of 158,793,284 people shows a slight negative correlation between the proportion of Icelanders and percentage of population with no schooling in the United States with a correlation coefficient (R) of -0.063 and weighted average of 1.7%. Similarly, the statistical analysis conducted on geographies consisting of 252,358,967 people shows no correlation between the proportion of Filipinos and percentage of population with no schooling in the United States with a correlation coefficient (R) of 0.019 and weighted average of 2.0%, a difference of 12.7%.
No Schooling Completed Correlation Summary
| Measurement | Icelander | Filipino |
| Minimum | 0.25% | 0.16% |
| Maximum | 3.4% | 4.5% |
| Range | 3.2% | 4.3% |
| Mean | 1.2% | 1.8% |
| Median | 0.97% | 1.7% |
| Interquartile 25% (IQ1) | 0.72% | 1.3% |
| Interquartile 75% (IQ3) | 1.5% | 2.2% |
| Interquartile Range (IQR) | 0.77% | 0.92% |
| Standard Deviation (Sample) | 0.71% | 0.84% |
| Standard Deviation (Population) | 0.70% | 0.83% |
Similar Demographics by No Schooling Completed
Demographics Similar to Icelanders by No Schooling Completed
In terms of no schooling completed, the demographic groups most similar to Icelanders are Cypriot (1.7%, a difference of 0.040%), Macedonian (1.7%, a difference of 0.050%), Immigrants from South Africa (1.7%, a difference of 0.090%), Delaware (1.7%, a difference of 0.13%), and Immigrants from Sweden (1.7%, a difference of 0.17%).
| Demographics | Rating | Rank | No Schooling Completed |
| Zimbabweans | 99.4 /100 | #74 | Exceptional 1.7% |
| Immigrants | Belgium | 99.3 /100 | #75 | Exceptional 1.7% |
| Cherokee | 99.3 /100 | #76 | Exceptional 1.7% |
| Immigrants | Sweden | 99.3 /100 | #77 | Exceptional 1.7% |
| Delaware | 99.3 /100 | #78 | Exceptional 1.7% |
| Macedonians | 99.3 /100 | #79 | Exceptional 1.7% |
| Cypriots | 99.3 /100 | #80 | Exceptional 1.7% |
| Icelanders | 99.3 /100 | #81 | Exceptional 1.7% |
| Immigrants | South Africa | 99.3 /100 | #82 | Exceptional 1.7% |
| Potawatomi | 99.3 /100 | #83 | Exceptional 1.7% |
| Immigrants | Denmark | 99.2 /100 | #84 | Exceptional 1.7% |
| Immigrants | Australia | 99.2 /100 | #85 | Exceptional 1.7% |
| Ukrainians | 99.2 /100 | #86 | Exceptional 1.8% |
| Osage | 99.2 /100 | #87 | Exceptional 1.8% |
| Immigrants | Western Europe | 99.2 /100 | #88 | Exceptional 1.8% |
Demographics Similar to Filipinos by No Schooling Completed
In terms of no schooling completed, the demographic groups most similar to Filipinos are Immigrants from Israel (2.0%, a difference of 0.030%), Jordanian (2.0%, a difference of 0.29%), Marshallese (2.0%, a difference of 0.55%), Immigrants from Greece (2.0%, a difference of 0.56%), and Burmese (1.9%, a difference of 0.86%).
| Demographics | Rating | Rank | No Schooling Completed |
| Palestinians | 91.8 /100 | #130 | Exceptional 1.9% |
| Immigrants | Hungary | 91.6 /100 | #131 | Exceptional 1.9% |
| Colville | 90.4 /100 | #132 | Exceptional 1.9% |
| Immigrants | Turkey | 90.2 /100 | #133 | Exceptional 1.9% |
| Menominee | 89.6 /100 | #134 | Excellent 1.9% |
| Hmong | 88.5 /100 | #135 | Excellent 1.9% |
| Burmese | 88.2 /100 | #136 | Excellent 1.9% |
| Filipinos | 85.5 /100 | #137 | Excellent 2.0% |
| Immigrants | Israel | 85.4 /100 | #138 | Excellent 2.0% |
| Jordanians | 84.5 /100 | #139 | Excellent 2.0% |
| Marshallese | 83.5 /100 | #140 | Excellent 2.0% |
| Immigrants | Greece | 83.5 /100 | #141 | Excellent 2.0% |
| Venezuelans | 81.5 /100 | #142 | Excellent 2.0% |
| Immigrants | South Central Asia | 80.0 /100 | #143 | Good 2.0% |
| Alsatians | 79.1 /100 | #144 | Good 2.0% |