Icelander vs Immigrants from Kuwait No Schooling Completed
COMPARE
Icelander
Immigrants from Kuwait
No Schooling Completed
No Schooling Completed Comparison
Icelanders
Immigrants from Kuwait
1.7%
NO SCHOOLING COMPLETED
99.3/ 100
METRIC RATING
81st/ 347
METRIC RANK
1.9%
NO SCHOOLING COMPLETED
93.9/ 100
METRIC RATING
123rd/ 347
METRIC RANK
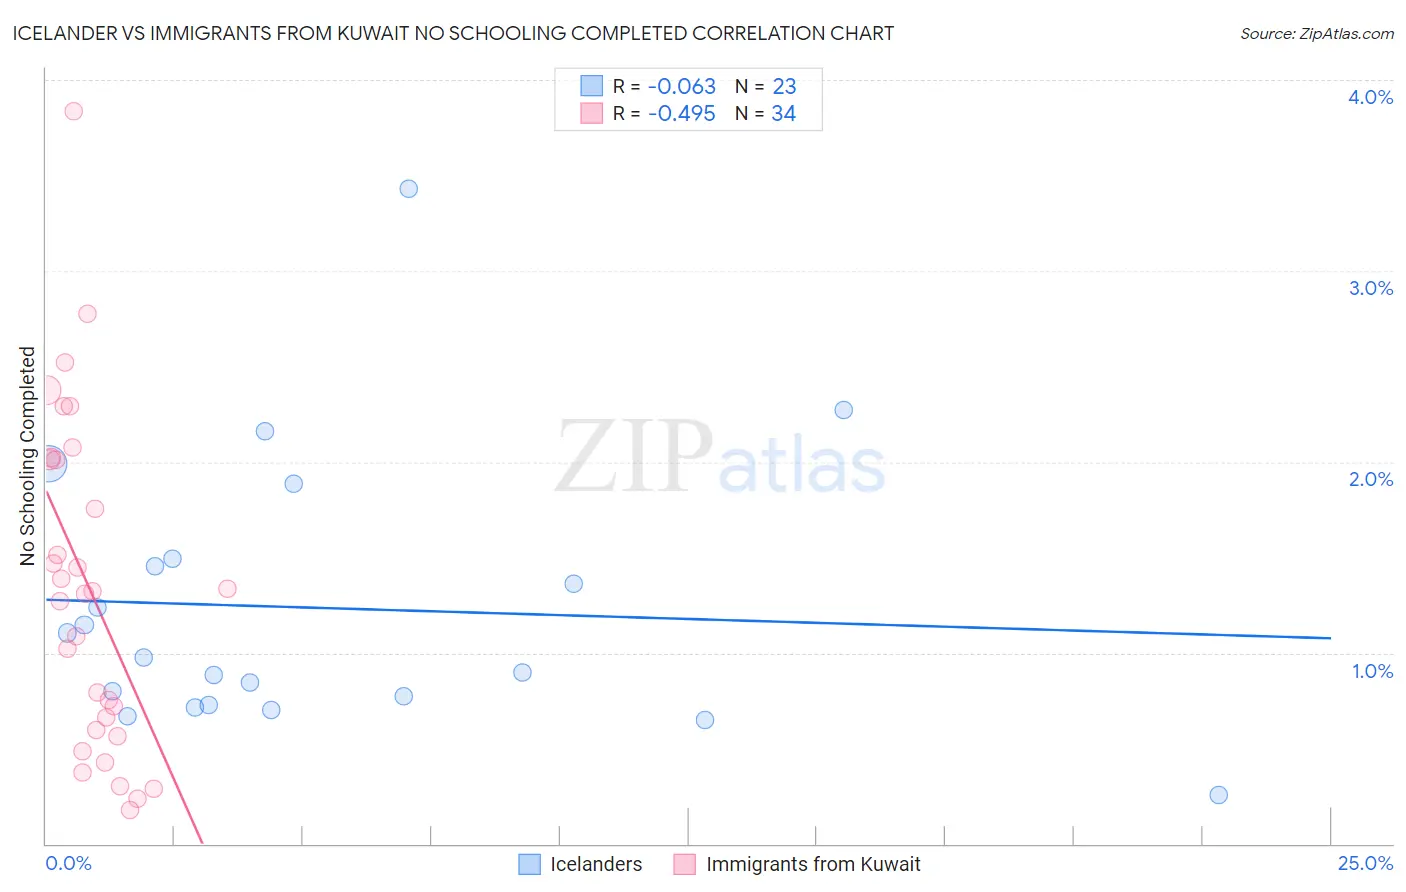
Icelander vs Immigrants from Kuwait No Schooling Completed Correlation Chart
The statistical analysis conducted on geographies consisting of 158,793,284 people shows a slight negative correlation between the proportion of Icelanders and percentage of population with no schooling in the United States with a correlation coefficient (R) of -0.063 and weighted average of 1.7%. Similarly, the statistical analysis conducted on geographies consisting of 136,467,547 people shows a moderate negative correlation between the proportion of Immigrants from Kuwait and percentage of population with no schooling in the United States with a correlation coefficient (R) of -0.495 and weighted average of 1.9%, a difference of 8.8%.
No Schooling Completed Correlation Summary
| Measurement | Icelander | Immigrants from Kuwait |
| Minimum | 0.25% | 0.18% |
| Maximum | 3.4% | 3.8% |
| Range | 3.2% | 3.7% |
| Mean | 1.2% | 1.3% |
| Median | 0.97% | 1.3% |
| Interquartile 25% (IQ1) | 0.72% | 0.59% |
| Interquartile 75% (IQ3) | 1.5% | 2.0% |
| Interquartile Range (IQR) | 0.77% | 1.4% |
| Standard Deviation (Sample) | 0.71% | 0.87% |
| Standard Deviation (Population) | 0.70% | 0.85% |
Similar Demographics by No Schooling Completed
Demographics Similar to Icelanders by No Schooling Completed
In terms of no schooling completed, the demographic groups most similar to Icelanders are Cypriot (1.7%, a difference of 0.040%), Macedonian (1.7%, a difference of 0.050%), Immigrants from South Africa (1.7%, a difference of 0.090%), Delaware (1.7%, a difference of 0.13%), and Immigrants from Sweden (1.7%, a difference of 0.17%).
| Demographics | Rating | Rank | No Schooling Completed |
| Zimbabweans | 99.4 /100 | #74 | Exceptional 1.7% |
| Immigrants | Belgium | 99.3 /100 | #75 | Exceptional 1.7% |
| Cherokee | 99.3 /100 | #76 | Exceptional 1.7% |
| Immigrants | Sweden | 99.3 /100 | #77 | Exceptional 1.7% |
| Delaware | 99.3 /100 | #78 | Exceptional 1.7% |
| Macedonians | 99.3 /100 | #79 | Exceptional 1.7% |
| Cypriots | 99.3 /100 | #80 | Exceptional 1.7% |
| Icelanders | 99.3 /100 | #81 | Exceptional 1.7% |
| Immigrants | South Africa | 99.3 /100 | #82 | Exceptional 1.7% |
| Potawatomi | 99.3 /100 | #83 | Exceptional 1.7% |
| Immigrants | Denmark | 99.2 /100 | #84 | Exceptional 1.7% |
| Immigrants | Australia | 99.2 /100 | #85 | Exceptional 1.7% |
| Ukrainians | 99.2 /100 | #86 | Exceptional 1.8% |
| Osage | 99.2 /100 | #87 | Exceptional 1.8% |
| Immigrants | Western Europe | 99.2 /100 | #88 | Exceptional 1.8% |
Demographics Similar to Immigrants from Kuwait by No Schooling Completed
In terms of no schooling completed, the demographic groups most similar to Immigrants from Kuwait are Cambodian (1.9%, a difference of 0.080%), Immigrants from Europe (1.9%, a difference of 0.17%), Cree (1.9%, a difference of 0.36%), Immigrants from Croatia (1.9%, a difference of 0.39%), and Immigrants from Bulgaria (1.9%, a difference of 0.46%).
| Demographics | Rating | Rank | No Schooling Completed |
| Lebanese | 96.0 /100 | #116 | Exceptional 1.9% |
| Immigrants | Serbia | 95.8 /100 | #117 | Exceptional 1.9% |
| Spanish | 95.5 /100 | #118 | Exceptional 1.9% |
| Iroquois | 95.1 /100 | #119 | Exceptional 1.9% |
| Immigrants | Bulgaria | 94.6 /100 | #120 | Exceptional 1.9% |
| Immigrants | Croatia | 94.5 /100 | #121 | Exceptional 1.9% |
| Cree | 94.5 /100 | #122 | Exceptional 1.9% |
| Immigrants | Kuwait | 93.9 /100 | #123 | Exceptional 1.9% |
| Cambodians | 93.8 /100 | #124 | Exceptional 1.9% |
| Immigrants | Europe | 93.7 /100 | #125 | Exceptional 1.9% |
| Immigrants | Romania | 92.6 /100 | #126 | Exceptional 1.9% |
| Israelis | 92.4 /100 | #127 | Exceptional 1.9% |
| Spaniards | 92.3 /100 | #128 | Exceptional 1.9% |
| Seminole | 92.0 /100 | #129 | Exceptional 1.9% |
| Palestinians | 91.8 /100 | #130 | Exceptional 1.9% |