Icelander vs Immigrants from Poland No Schooling Completed
COMPARE
Icelander
Immigrants from Poland
No Schooling Completed
No Schooling Completed Comparison
Icelanders
Immigrants from Poland
1.7%
NO SCHOOLING COMPLETED
99.3/ 100
METRIC RATING
81st/ 347
METRIC RANK
2.1%
NO SCHOOLING COMPLETED
55.2/ 100
METRIC RATING
171st/ 347
METRIC RANK
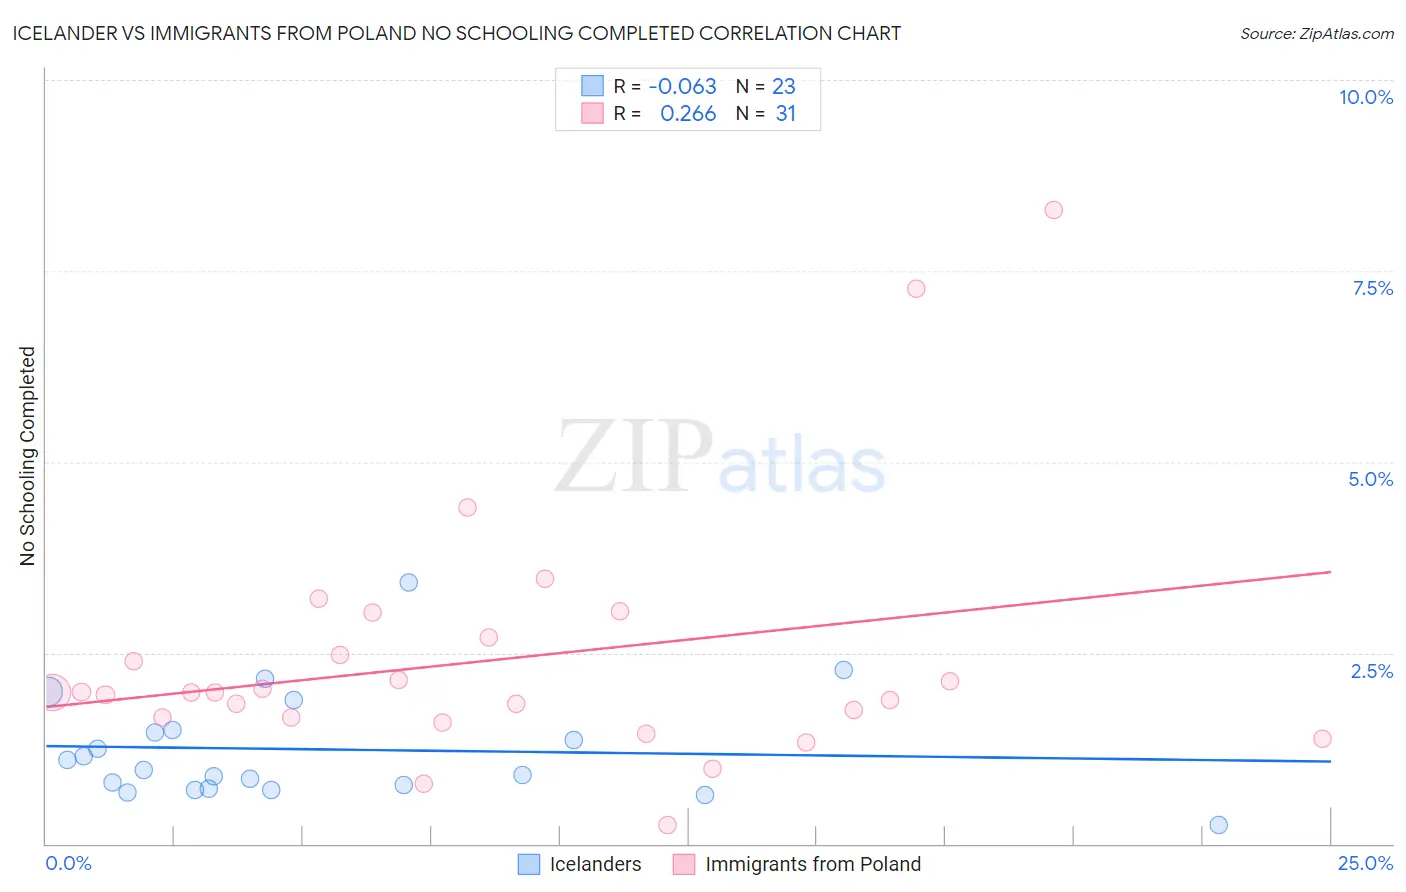
Icelander vs Immigrants from Poland No Schooling Completed Correlation Chart
The statistical analysis conducted on geographies consisting of 158,793,284 people shows a slight negative correlation between the proportion of Icelanders and percentage of population with no schooling in the United States with a correlation coefficient (R) of -0.063 and weighted average of 1.7%. Similarly, the statistical analysis conducted on geographies consisting of 302,129,066 people shows a weak positive correlation between the proportion of Immigrants from Poland and percentage of population with no schooling in the United States with a correlation coefficient (R) of 0.266 and weighted average of 2.1%, a difference of 19.0%.
No Schooling Completed Correlation Summary
| Measurement | Icelander | Immigrants from Poland |
| Minimum | 0.25% | 0.25% |
| Maximum | 3.4% | 8.3% |
| Range | 3.2% | 8.0% |
| Mean | 1.2% | 2.4% |
| Median | 0.97% | 2.0% |
| Interquartile 25% (IQ1) | 0.72% | 1.6% |
| Interquartile 75% (IQ3) | 1.5% | 2.7% |
| Interquartile Range (IQR) | 0.77% | 1.0% |
| Standard Deviation (Sample) | 0.71% | 1.7% |
| Standard Deviation (Population) | 0.70% | 1.6% |
Similar Demographics by No Schooling Completed
Demographics Similar to Icelanders by No Schooling Completed
In terms of no schooling completed, the demographic groups most similar to Icelanders are Cypriot (1.7%, a difference of 0.040%), Macedonian (1.7%, a difference of 0.050%), Immigrants from South Africa (1.7%, a difference of 0.090%), Delaware (1.7%, a difference of 0.13%), and Immigrants from Sweden (1.7%, a difference of 0.17%).
| Demographics | Rating | Rank | No Schooling Completed |
| Zimbabweans | 99.4 /100 | #74 | Exceptional 1.7% |
| Immigrants | Belgium | 99.3 /100 | #75 | Exceptional 1.7% |
| Cherokee | 99.3 /100 | #76 | Exceptional 1.7% |
| Immigrants | Sweden | 99.3 /100 | #77 | Exceptional 1.7% |
| Delaware | 99.3 /100 | #78 | Exceptional 1.7% |
| Macedonians | 99.3 /100 | #79 | Exceptional 1.7% |
| Cypriots | 99.3 /100 | #80 | Exceptional 1.7% |
| Icelanders | 99.3 /100 | #81 | Exceptional 1.7% |
| Immigrants | South Africa | 99.3 /100 | #82 | Exceptional 1.7% |
| Potawatomi | 99.3 /100 | #83 | Exceptional 1.7% |
| Immigrants | Denmark | 99.2 /100 | #84 | Exceptional 1.7% |
| Immigrants | Australia | 99.2 /100 | #85 | Exceptional 1.7% |
| Ukrainians | 99.2 /100 | #86 | Exceptional 1.8% |
| Osage | 99.2 /100 | #87 | Exceptional 1.8% |
| Immigrants | Western Europe | 99.2 /100 | #88 | Exceptional 1.8% |
Demographics Similar to Immigrants from Poland by No Schooling Completed
In terms of no schooling completed, the demographic groups most similar to Immigrants from Poland are Argentinean (2.1%, a difference of 0.11%), Apache (2.1%, a difference of 0.20%), Immigrants from Argentina (2.1%, a difference of 0.33%), Immigrants from Belarus (2.1%, a difference of 0.46%), and Cheyenne (2.1%, a difference of 0.47%).
| Demographics | Rating | Rank | No Schooling Completed |
| Comanche | 60.7 /100 | #164 | Good 2.1% |
| Brazilians | 60.2 /100 | #165 | Good 2.1% |
| Dutch West Indians | 59.9 /100 | #166 | Average 2.1% |
| Egyptians | 59.2 /100 | #167 | Average 2.1% |
| Cheyenne | 58.6 /100 | #168 | Average 2.1% |
| Apache | 56.7 /100 | #169 | Average 2.1% |
| Argentineans | 56.0 /100 | #170 | Average 2.1% |
| Immigrants | Poland | 55.2 /100 | #171 | Average 2.1% |
| Immigrants | Argentina | 52.7 /100 | #172 | Average 2.1% |
| Immigrants | Belarus | 51.8 /100 | #173 | Average 2.1% |
| Immigrants | Micronesia | 50.0 /100 | #174 | Average 2.1% |
| Arabs | 46.4 /100 | #175 | Average 2.1% |
| Panamanians | 45.2 /100 | #176 | Average 2.1% |
| Arapaho | 45.0 /100 | #177 | Average 2.1% |
| Pakistanis | 44.7 /100 | #178 | Average 2.1% |