Icelander vs Trinidadian and Tobagonian Ambulatory Disability
COMPARE
Icelander
Trinidadian and Tobagonian
Ambulatory Disability
Ambulatory Disability Comparison
Icelanders
Trinidadians and Tobagonians
5.9%
AMBULATORY DISABILITY
92.6/ 100
METRIC RATING
122nd/ 347
METRIC RANK
6.6%
AMBULATORY DISABILITY
0.2/ 100
METRIC RATING
267th/ 347
METRIC RANK
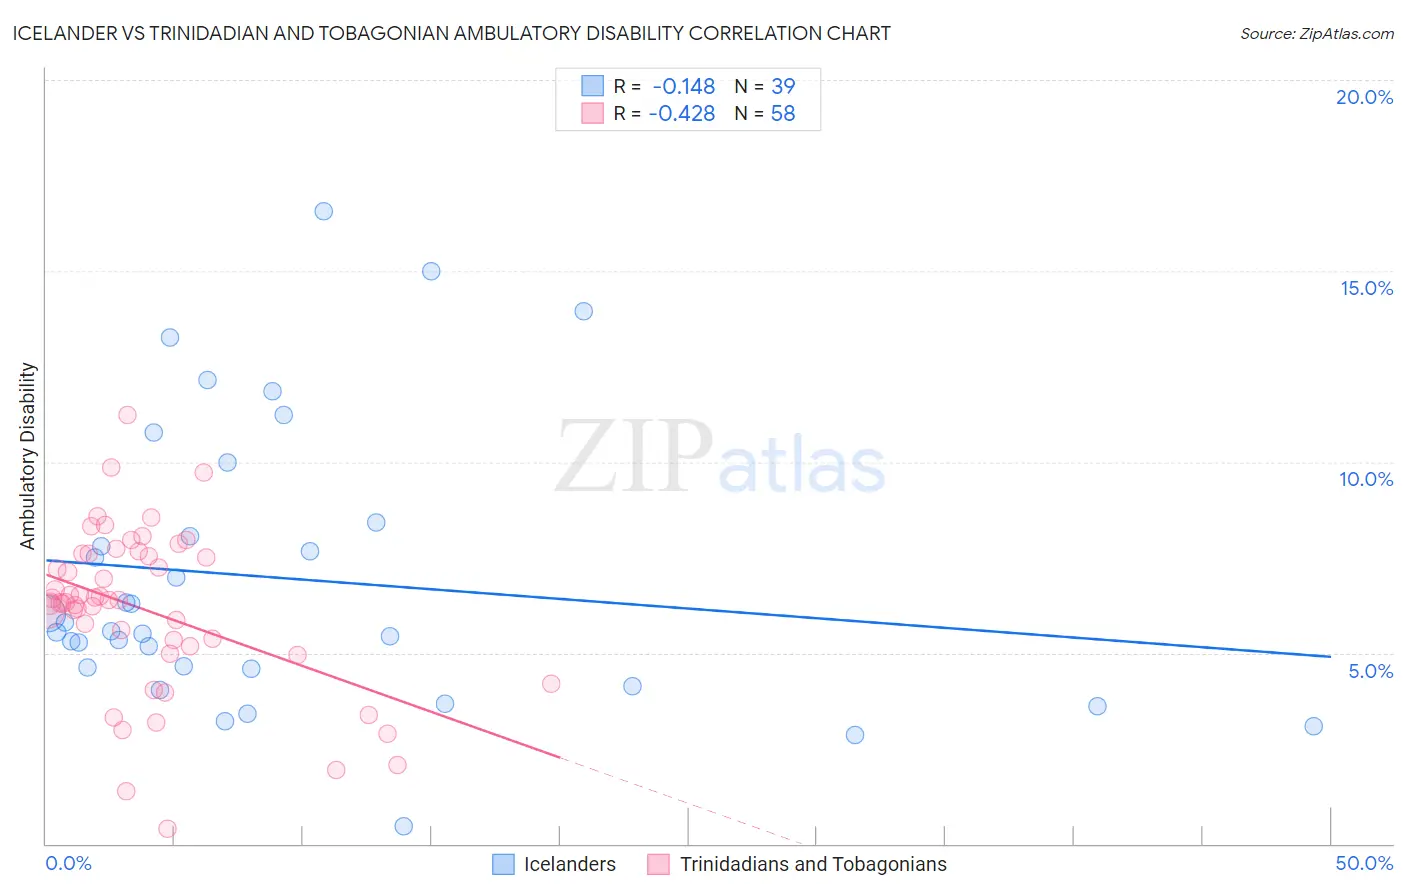
Icelander vs Trinidadian and Tobagonian Ambulatory Disability Correlation Chart
The statistical analysis conducted on geographies consisting of 159,642,692 people shows a poor negative correlation between the proportion of Icelanders and percentage of population with ambulatory disability in the United States with a correlation coefficient (R) of -0.148 and weighted average of 5.9%. Similarly, the statistical analysis conducted on geographies consisting of 219,787,552 people shows a moderate negative correlation between the proportion of Trinidadians and Tobagonians and percentage of population with ambulatory disability in the United States with a correlation coefficient (R) of -0.428 and weighted average of 6.6%, a difference of 12.1%.
Ambulatory Disability Correlation Summary
| Measurement | Icelander | Trinidadian and Tobagonian |
| Minimum | 0.47% | 0.38% |
| Maximum | 16.5% | 11.2% |
| Range | 16.1% | 10.8% |
| Mean | 6.9% | 6.1% |
| Median | 5.6% | 6.3% |
| Interquartile 25% (IQ1) | 4.6% | 5.2% |
| Interquartile 75% (IQ3) | 8.4% | 7.6% |
| Interquartile Range (IQR) | 3.8% | 2.4% |
| Standard Deviation (Sample) | 3.7% | 2.1% |
| Standard Deviation (Population) | 3.7% | 2.1% |
Similar Demographics by Ambulatory Disability
Demographics Similar to Icelanders by Ambulatory Disability
In terms of ambulatory disability, the demographic groups most similar to Icelanders are Costa Rican (5.9%, a difference of 0.0%), Immigrants from Russia (5.9%, a difference of 0.020%), Immigrants from Middle Africa (5.9%, a difference of 0.060%), Estonian (5.9%, a difference of 0.070%), and Norwegian (5.9%, a difference of 0.11%).
| Demographics | Rating | Rank | Ambulatory Disability |
| South American Indians | 94.8 /100 | #115 | Exceptional 5.9% |
| Immigrants | Africa | 94.7 /100 | #116 | Exceptional 5.9% |
| Immigrants | South Eastern Asia | 93.6 /100 | #117 | Exceptional 5.9% |
| Russians | 93.4 /100 | #118 | Exceptional 5.9% |
| Norwegians | 93.1 /100 | #119 | Exceptional 5.9% |
| Estonians | 92.9 /100 | #120 | Exceptional 5.9% |
| Costa Ricans | 92.6 /100 | #121 | Exceptional 5.9% |
| Icelanders | 92.6 /100 | #122 | Exceptional 5.9% |
| Immigrants | Russia | 92.4 /100 | #123 | Exceptional 5.9% |
| Immigrants | Middle Africa | 92.2 /100 | #124 | Exceptional 5.9% |
| Koreans | 91.6 /100 | #125 | Exceptional 5.9% |
| Arabs | 91.5 /100 | #126 | Exceptional 5.9% |
| Immigrants | Nigeria | 90.9 /100 | #127 | Exceptional 5.9% |
| Immigrants | Western Asia | 90.7 /100 | #128 | Exceptional 5.9% |
| Immigrants | Norway | 90.5 /100 | #129 | Exceptional 5.9% |
Demographics Similar to Trinidadians and Tobagonians by Ambulatory Disability
In terms of ambulatory disability, the demographic groups most similar to Trinidadians and Tobagonians are Spanish (6.6%, a difference of 0.020%), Guyanese (6.6%, a difference of 0.13%), Bahamian (6.6%, a difference of 0.25%), Nepalese (6.6%, a difference of 0.31%), and French (6.6%, a difference of 0.32%).
| Demographics | Rating | Rank | Ambulatory Disability |
| Immigrants | Belize | 0.4 /100 | #260 | Tragic 6.6% |
| Irish | 0.4 /100 | #261 | Tragic 6.6% |
| English | 0.4 /100 | #262 | Tragic 6.6% |
| Hmong | 0.3 /100 | #263 | Tragic 6.6% |
| Nepalese | 0.2 /100 | #264 | Tragic 6.6% |
| Bahamians | 0.2 /100 | #265 | Tragic 6.6% |
| Guyanese | 0.2 /100 | #266 | Tragic 6.6% |
| Trinidadians and Tobagonians | 0.2 /100 | #267 | Tragic 6.6% |
| Spanish | 0.2 /100 | #268 | Tragic 6.6% |
| French | 0.1 /100 | #269 | Tragic 6.6% |
| Slovaks | 0.1 /100 | #270 | Tragic 6.7% |
| Immigrants | Trinidad and Tobago | 0.1 /100 | #271 | Tragic 6.7% |
| French Canadians | 0.1 /100 | #272 | Tragic 6.7% |
| Whites/Caucasians | 0.1 /100 | #273 | Tragic 6.7% |
| Sioux | 0.1 /100 | #274 | Tragic 6.7% |