Latvian vs Trinidadian and Tobagonian No Schooling Completed
COMPARE
Latvian
Trinidadian and Tobagonian
No Schooling Completed
No Schooling Completed Comparison
Latvians
Trinidadians and Tobagonians
1.5%
NO SCHOOLING COMPLETED
100.0/ 100
METRIC RATING
34th/ 347
METRIC RANK
2.6%
NO SCHOOLING COMPLETED
0.1/ 100
METRIC RATING
280th/ 347
METRIC RANK
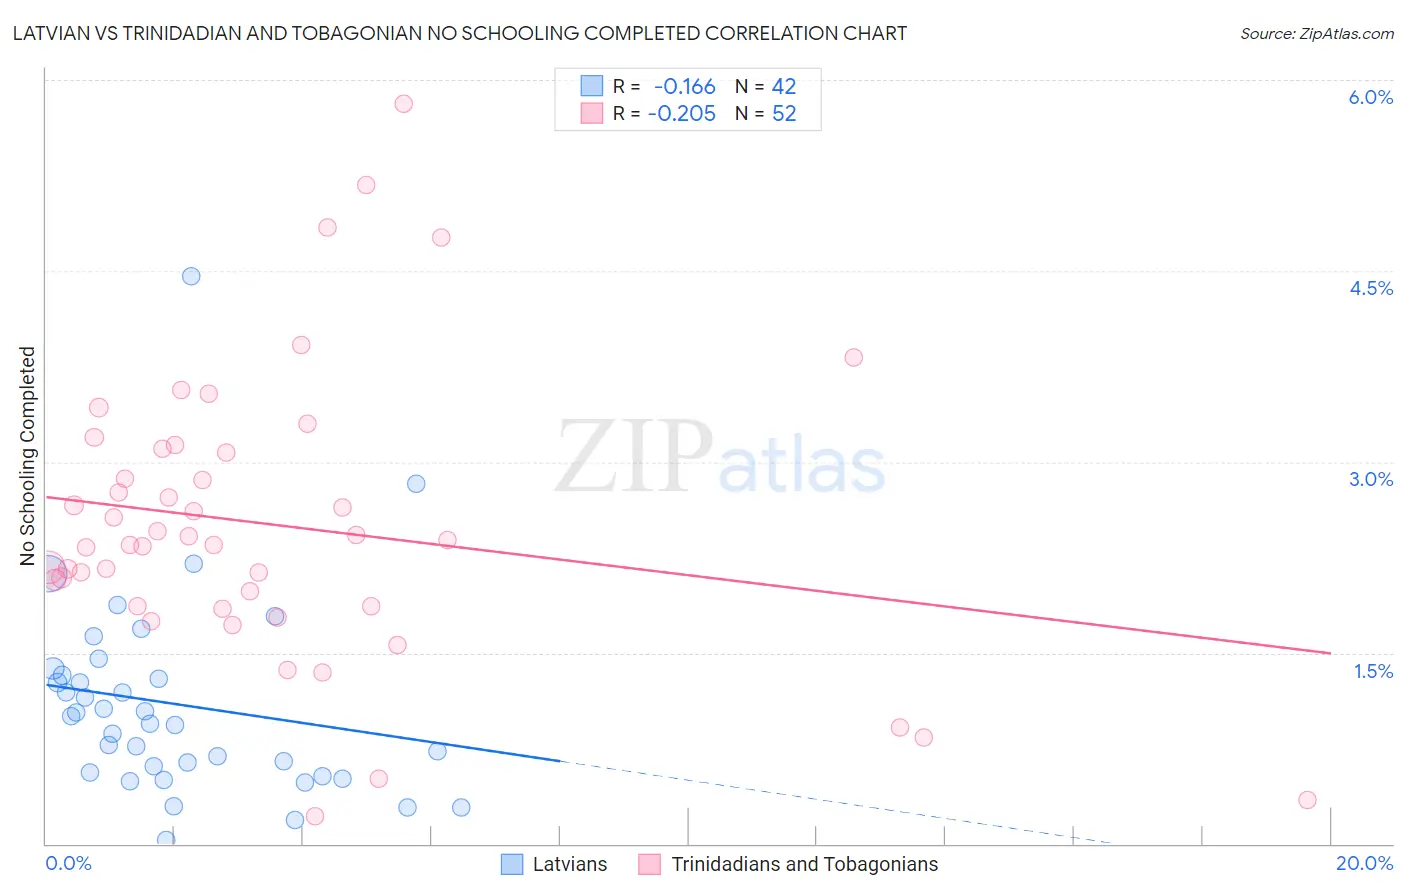
Latvian vs Trinidadian and Tobagonian No Schooling Completed Correlation Chart
The statistical analysis conducted on geographies consisting of 219,073,605 people shows a poor negative correlation between the proportion of Latvians and percentage of population with no schooling in the United States with a correlation coefficient (R) of -0.166 and weighted average of 1.5%. Similarly, the statistical analysis conducted on geographies consisting of 219,048,767 people shows a weak negative correlation between the proportion of Trinidadians and Tobagonians and percentage of population with no schooling in the United States with a correlation coefficient (R) of -0.205 and weighted average of 2.6%, a difference of 68.5%.
No Schooling Completed Correlation Summary
| Measurement | Latvian | Trinidadian and Tobagonian |
| Minimum | 0.028% | 0.22% |
| Maximum | 4.5% | 5.8% |
| Range | 4.4% | 5.6% |
| Mean | 1.1% | 2.5% |
| Median | 0.97% | 2.4% |
| Interquartile 25% (IQ1) | 0.56% | 1.9% |
| Interquartile 75% (IQ3) | 1.3% | 3.1% |
| Interquartile Range (IQR) | 0.76% | 1.2% |
| Standard Deviation (Sample) | 0.80% | 1.1% |
| Standard Deviation (Population) | 0.79% | 1.1% |
Similar Demographics by No Schooling Completed
Demographics Similar to Latvians by No Schooling Completed
In terms of no schooling completed, the demographic groups most similar to Latvians are Italian (1.5%, a difference of 0.25%), Swiss (1.5%, a difference of 0.94%), Eastern European (1.6%, a difference of 0.95%), Inupiat (1.5%, a difference of 1.3%), and British (1.5%, a difference of 1.4%).
| Demographics | Rating | Rank | No Schooling Completed |
| Scandinavians | 100.0 /100 | #27 | Exceptional 1.5% |
| French Canadians | 100.0 /100 | #28 | Exceptional 1.5% |
| Lumbee | 100.0 /100 | #29 | Exceptional 1.5% |
| British | 100.0 /100 | #30 | Exceptional 1.5% |
| Inupiat | 100.0 /100 | #31 | Exceptional 1.5% |
| Swiss | 100.0 /100 | #32 | Exceptional 1.5% |
| Italians | 100.0 /100 | #33 | Exceptional 1.5% |
| Latvians | 100.0 /100 | #34 | Exceptional 1.5% |
| Eastern Europeans | 100.0 /100 | #35 | Exceptional 1.6% |
| Aleuts | 99.9 /100 | #36 | Exceptional 1.6% |
| Belgians | 99.9 /100 | #37 | Exceptional 1.6% |
| Northern Europeans | 99.9 /100 | #38 | Exceptional 1.6% |
| Native Hawaiians | 99.9 /100 | #39 | Exceptional 1.6% |
| Luxembourgers | 99.9 /100 | #40 | Exceptional 1.6% |
| Hungarians | 99.9 /100 | #41 | Exceptional 1.6% |
Demographics Similar to Trinidadians and Tobagonians by No Schooling Completed
In terms of no schooling completed, the demographic groups most similar to Trinidadians and Tobagonians are Barbadian (2.6%, a difference of 0.020%), Afghan (2.6%, a difference of 0.080%), Immigrants from Ghana (2.6%, a difference of 0.28%), Immigrants from Uzbekistan (2.6%, a difference of 0.56%), and Immigrants from Philippines (2.6%, a difference of 0.76%).
| Demographics | Rating | Rank | No Schooling Completed |
| Immigrants | Cameroon | 0.1 /100 | #273 | Tragic 2.5% |
| Ghanaians | 0.1 /100 | #274 | Tragic 2.6% |
| Immigrants | China | 0.1 /100 | #275 | Tragic 2.6% |
| Immigrants | Western Africa | 0.1 /100 | #276 | Tragic 2.6% |
| Immigrants | Philippines | 0.1 /100 | #277 | Tragic 2.6% |
| Immigrants | Uzbekistan | 0.1 /100 | #278 | Tragic 2.6% |
| Barbadians | 0.1 /100 | #279 | Tragic 2.6% |
| Trinidadians and Tobagonians | 0.1 /100 | #280 | Tragic 2.6% |
| Afghans | 0.1 /100 | #281 | Tragic 2.6% |
| Immigrants | Ghana | 0.1 /100 | #282 | Tragic 2.6% |
| Immigrants | Trinidad and Tobago | 0.0 /100 | #283 | Tragic 2.6% |
| Immigrants | West Indies | 0.0 /100 | #284 | Tragic 2.7% |
| Immigrants | Barbados | 0.0 /100 | #285 | Tragic 2.7% |
| Immigrants | Portugal | 0.0 /100 | #286 | Tragic 2.7% |
| Immigrants | Afghanistan | 0.0 /100 | #287 | Tragic 2.7% |