Malaysian vs Immigrants from Grenada No Schooling Completed
COMPARE
Malaysian
Immigrants from Grenada
No Schooling Completed
No Schooling Completed Comparison
Malaysians
Immigrants from Grenada
2.8%
NO SCHOOLING COMPLETED
0.0/ 100
METRIC RATING
293rd/ 347
METRIC RANK
2.8%
NO SCHOOLING COMPLETED
0.0/ 100
METRIC RATING
292nd/ 347
METRIC RANK
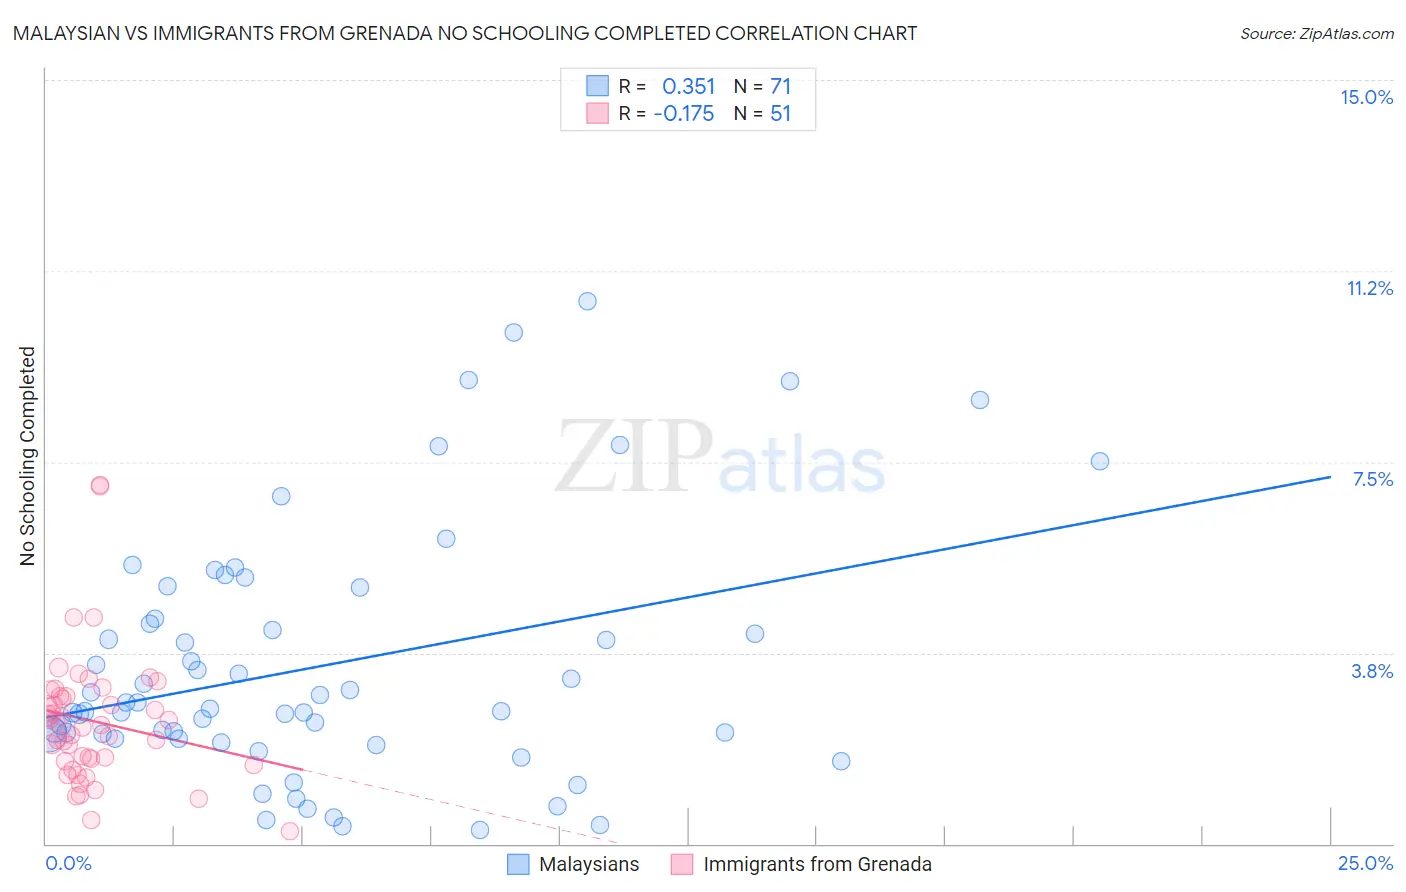
Malaysian vs Immigrants from Grenada No Schooling Completed Correlation Chart
The statistical analysis conducted on geographies consisting of 225,077,175 people shows a mild positive correlation between the proportion of Malaysians and percentage of population with no schooling in the United States with a correlation coefficient (R) of 0.351 and weighted average of 2.8%. Similarly, the statistical analysis conducted on geographies consisting of 67,145,019 people shows a poor negative correlation between the proportion of Immigrants from Grenada and percentage of population with no schooling in the United States with a correlation coefficient (R) of -0.175 and weighted average of 2.8%, a difference of 0.41%.
No Schooling Completed Correlation Summary
| Measurement | Malaysian | Immigrants from Grenada |
| Minimum | 0.27% | 0.24% |
| Maximum | 10.6% | 7.1% |
| Range | 10.4% | 6.8% |
| Mean | 3.5% | 2.4% |
| Median | 2.7% | 2.3% |
| Interquartile 25% (IQ1) | 2.1% | 1.6% |
| Interquartile 75% (IQ3) | 4.4% | 2.9% |
| Interquartile Range (IQR) | 2.4% | 1.3% |
| Standard Deviation (Sample) | 2.4% | 1.3% |
| Standard Deviation (Population) | 2.4% | 1.3% |
Demographics Similar to Malaysians and Immigrants from Grenada by No Schooling Completed
In terms of no schooling completed, the demographic groups most similar to Malaysians are Immigrants from Eritrea (2.8%, a difference of 0.17%), Houma (2.8%, a difference of 0.69%), Immigrants (2.8%, a difference of 0.79%), British West Indian (2.7%, a difference of 1.5%), and Immigrants from Cuba (2.8%, a difference of 1.9%). Similarly, the demographic groups most similar to Immigrants from Grenada are Immigrants from Eritrea (2.8%, a difference of 0.58%), British West Indian (2.7%, a difference of 1.1%), Houma (2.8%, a difference of 1.1%), Immigrants (2.8%, a difference of 1.2%), and Immigrants from Hong Kong (2.7%, a difference of 1.9%).
| Demographics | Rating | Rank | No Schooling Completed |
| Immigrants | Ghana | 0.1 /100 | #282 | Tragic 2.6% |
| Immigrants | Trinidad and Tobago | 0.0 /100 | #283 | Tragic 2.6% |
| Immigrants | West Indies | 0.0 /100 | #284 | Tragic 2.7% |
| Immigrants | Barbados | 0.0 /100 | #285 | Tragic 2.7% |
| Immigrants | Portugal | 0.0 /100 | #286 | Tragic 2.7% |
| Immigrants | Afghanistan | 0.0 /100 | #287 | Tragic 2.7% |
| Immigrants | St. Vincent and the Grenadines | 0.0 /100 | #288 | Tragic 2.7% |
| Immigrants | Thailand | 0.0 /100 | #289 | Tragic 2.7% |
| Immigrants | Hong Kong | 0.0 /100 | #290 | Tragic 2.7% |
| British West Indians | 0.0 /100 | #291 | Tragic 2.7% |
| Immigrants | Grenada | 0.0 /100 | #292 | Tragic 2.8% |
| Malaysians | 0.0 /100 | #293 | Tragic 2.8% |
| Immigrants | Eritrea | 0.0 /100 | #294 | Tragic 2.8% |
| Houma | 0.0 /100 | #295 | Tragic 2.8% |
| Immigrants | Immigrants | 0.0 /100 | #296 | Tragic 2.8% |
| Immigrants | Cuba | 0.0 /100 | #297 | Tragic 2.8% |
| Immigrants | Dominica | 0.0 /100 | #298 | Tragic 2.8% |
| Central American Indians | 0.0 /100 | #299 | Tragic 2.8% |
| Haitians | 0.0 /100 | #300 | Tragic 2.9% |
| Immigrants | South Eastern Asia | 0.0 /100 | #301 | Tragic 2.9% |
| Immigrants | Caribbean | 0.0 /100 | #302 | Tragic 2.9% |