Norwegian vs Immigrants from Grenada No Schooling Completed
COMPARE
Norwegian
Immigrants from Grenada
No Schooling Completed
No Schooling Completed Comparison
Norwegians
Immigrants from Grenada
1.3%
NO SCHOOLING COMPLETED
100.0/ 100
METRIC RATING
3rd/ 347
METRIC RANK
2.8%
NO SCHOOLING COMPLETED
0.0/ 100
METRIC RATING
292nd/ 347
METRIC RANK
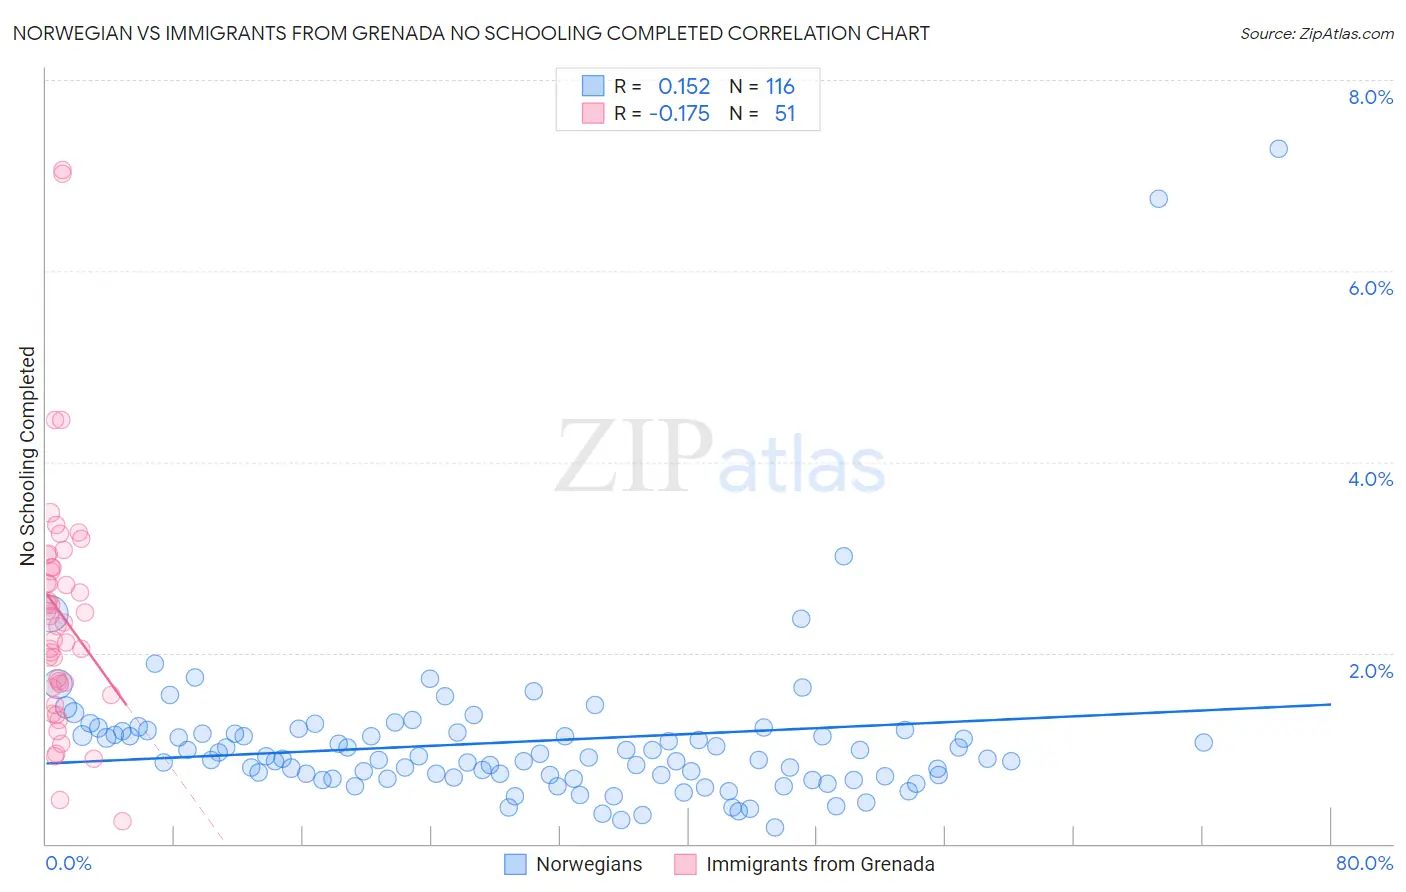
Norwegian vs Immigrants from Grenada No Schooling Completed Correlation Chart
The statistical analysis conducted on geographies consisting of 518,592,582 people shows a poor positive correlation between the proportion of Norwegians and percentage of population with no schooling in the United States with a correlation coefficient (R) of 0.152 and weighted average of 1.3%. Similarly, the statistical analysis conducted on geographies consisting of 67,145,019 people shows a poor negative correlation between the proportion of Immigrants from Grenada and percentage of population with no schooling in the United States with a correlation coefficient (R) of -0.175 and weighted average of 2.8%, a difference of 104.4%.
No Schooling Completed Correlation Summary
| Measurement | Norwegian | Immigrants from Grenada |
| Minimum | 0.17% | 0.24% |
| Maximum | 7.3% | 7.1% |
| Range | 7.1% | 6.8% |
| Mean | 1.1% | 2.4% |
| Median | 0.89% | 2.3% |
| Interquartile 25% (IQ1) | 0.70% | 1.6% |
| Interquartile 75% (IQ3) | 1.2% | 2.9% |
| Interquartile Range (IQR) | 0.46% | 1.3% |
| Standard Deviation (Sample) | 0.90% | 1.3% |
| Standard Deviation (Population) | 0.90% | 1.3% |
Similar Demographics by No Schooling Completed
Demographics Similar to Norwegians by No Schooling Completed
In terms of no schooling completed, the demographic groups most similar to Norwegians are Slovak (1.3%, a difference of 0.43%), German (1.4%, a difference of 0.56%), Slovene (1.4%, a difference of 0.98%), Carpatho Rusyn (1.4%, a difference of 1.8%), and English (1.4%, a difference of 2.8%).
| Demographics | Rating | Rank | No Schooling Completed |
| Yup'ik | 100.0 /100 | #1 | Exceptional 1.2% |
| Slovaks | 100.0 /100 | #2 | Exceptional 1.3% |
| Norwegians | 100.0 /100 | #3 | Exceptional 1.3% |
| Germans | 100.0 /100 | #4 | Exceptional 1.4% |
| Slovenes | 100.0 /100 | #5 | Exceptional 1.4% |
| Carpatho Rusyns | 100.0 /100 | #6 | Exceptional 1.4% |
| English | 100.0 /100 | #7 | Exceptional 1.4% |
| Swedes | 100.0 /100 | #8 | Exceptional 1.4% |
| Scottish | 100.0 /100 | #9 | Exceptional 1.4% |
| Dutch | 100.0 /100 | #10 | Exceptional 1.4% |
| Lithuanians | 100.0 /100 | #11 | Exceptional 1.4% |
| Irish | 100.0 /100 | #12 | Exceptional 1.4% |
| Poles | 100.0 /100 | #13 | Exceptional 1.4% |
| Scotch-Irish | 100.0 /100 | #14 | Exceptional 1.5% |
| Tlingit-Haida | 100.0 /100 | #15 | Exceptional 1.5% |
Demographics Similar to Immigrants from Grenada by No Schooling Completed
In terms of no schooling completed, the demographic groups most similar to Immigrants from Grenada are Malaysian (2.8%, a difference of 0.41%), Immigrants from Eritrea (2.8%, a difference of 0.58%), British West Indian (2.7%, a difference of 1.1%), Houma (2.8%, a difference of 1.1%), and Immigrants (2.8%, a difference of 1.2%).
| Demographics | Rating | Rank | No Schooling Completed |
| Immigrants | Barbados | 0.0 /100 | #285 | Tragic 2.7% |
| Immigrants | Portugal | 0.0 /100 | #286 | Tragic 2.7% |
| Immigrants | Afghanistan | 0.0 /100 | #287 | Tragic 2.7% |
| Immigrants | St. Vincent and the Grenadines | 0.0 /100 | #288 | Tragic 2.7% |
| Immigrants | Thailand | 0.0 /100 | #289 | Tragic 2.7% |
| Immigrants | Hong Kong | 0.0 /100 | #290 | Tragic 2.7% |
| British West Indians | 0.0 /100 | #291 | Tragic 2.7% |
| Immigrants | Grenada | 0.0 /100 | #292 | Tragic 2.8% |
| Malaysians | 0.0 /100 | #293 | Tragic 2.8% |
| Immigrants | Eritrea | 0.0 /100 | #294 | Tragic 2.8% |
| Houma | 0.0 /100 | #295 | Tragic 2.8% |
| Immigrants | Immigrants | 0.0 /100 | #296 | Tragic 2.8% |
| Immigrants | Cuba | 0.0 /100 | #297 | Tragic 2.8% |
| Immigrants | Dominica | 0.0 /100 | #298 | Tragic 2.8% |
| Central American Indians | 0.0 /100 | #299 | Tragic 2.8% |