Immigrants from Philippines vs Immigrants from Grenada No Schooling Completed
COMPARE
Immigrants from Philippines
Immigrants from Grenada
No Schooling Completed
No Schooling Completed Comparison
Immigrants from Philippines
Immigrants from Grenada
2.6%
NO SCHOOLING COMPLETED
0.1/ 100
METRIC RATING
277th/ 347
METRIC RANK
2.8%
NO SCHOOLING COMPLETED
0.0/ 100
METRIC RATING
292nd/ 347
METRIC RANK
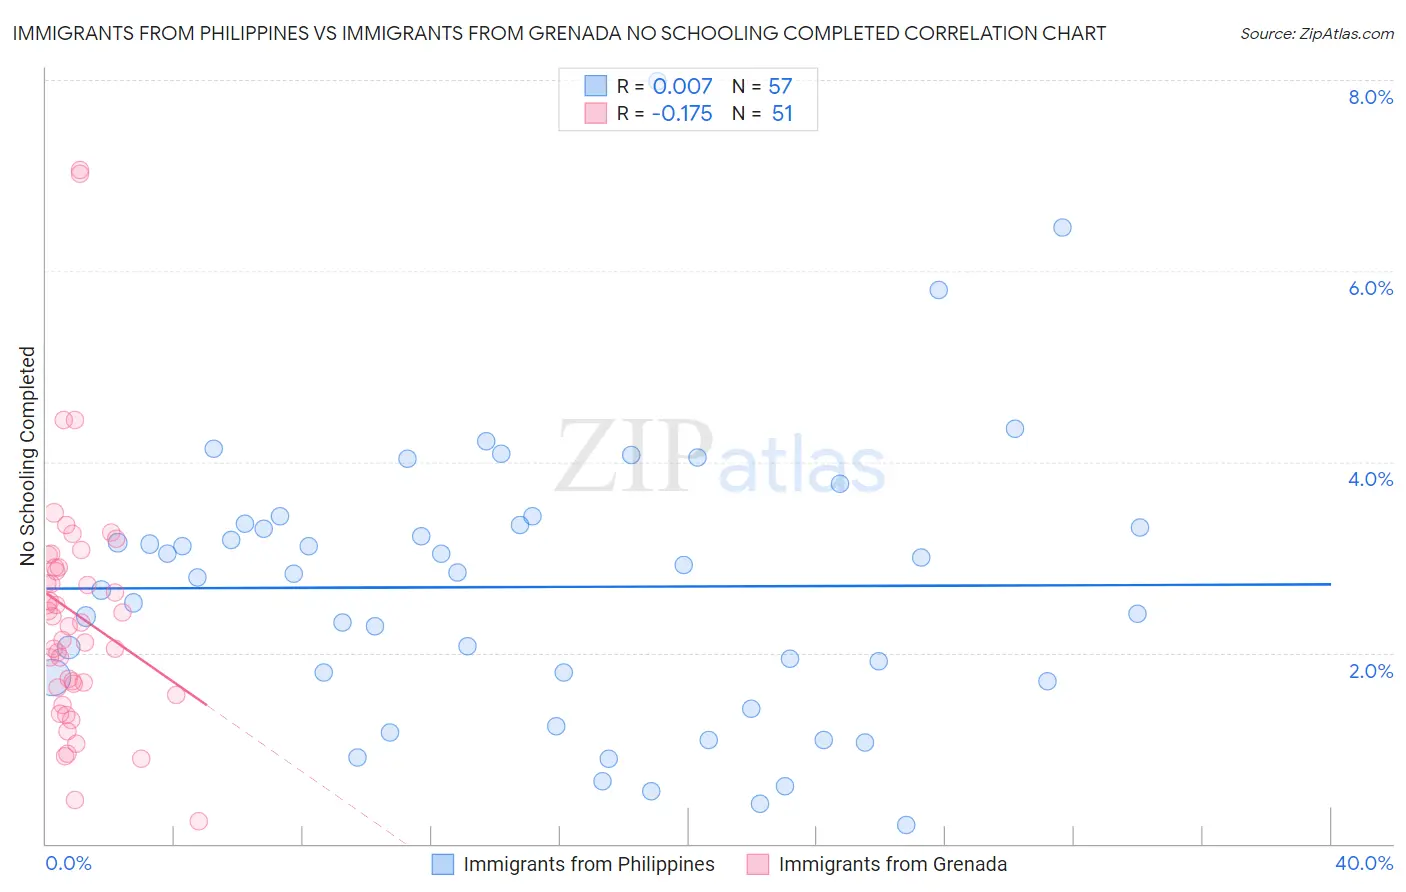
Immigrants from Philippines vs Immigrants from Grenada No Schooling Completed Correlation Chart
The statistical analysis conducted on geographies consisting of 465,179,873 people shows no correlation between the proportion of Immigrants from Philippines and percentage of population with no schooling in the United States with a correlation coefficient (R) of 0.007 and weighted average of 2.6%. Similarly, the statistical analysis conducted on geographies consisting of 67,145,019 people shows a poor negative correlation between the proportion of Immigrants from Grenada and percentage of population with no schooling in the United States with a correlation coefficient (R) of -0.175 and weighted average of 2.8%, a difference of 6.9%.
No Schooling Completed Correlation Summary
| Measurement | Immigrants from Philippines | Immigrants from Grenada |
| Minimum | 0.20% | 0.24% |
| Maximum | 8.0% | 7.1% |
| Range | 7.8% | 6.8% |
| Mean | 2.7% | 2.4% |
| Median | 2.8% | 2.3% |
| Interquartile 25% (IQ1) | 1.7% | 1.6% |
| Interquartile 75% (IQ3) | 3.3% | 2.9% |
| Interquartile Range (IQR) | 1.6% | 1.3% |
| Standard Deviation (Sample) | 1.5% | 1.3% |
| Standard Deviation (Population) | 1.5% | 1.3% |
Demographics Similar to Immigrants from Philippines and Immigrants from Grenada by No Schooling Completed
In terms of no schooling completed, the demographic groups most similar to Immigrants from Philippines are Immigrants from Western Africa (2.6%, a difference of 0.050%), Immigrants from Uzbekistan (2.6%, a difference of 0.20%), Immigrants from China (2.6%, a difference of 0.61%), Barbadian (2.6%, a difference of 0.74%), and Trinidadian and Tobagonian (2.6%, a difference of 0.76%). Similarly, the demographic groups most similar to Immigrants from Grenada are Malaysian (2.8%, a difference of 0.41%), Immigrants from Eritrea (2.8%, a difference of 0.58%), British West Indian (2.7%, a difference of 1.1%), Immigrants from Hong Kong (2.7%, a difference of 1.9%), and Immigrants from Thailand (2.7%, a difference of 2.0%).
| Demographics | Rating | Rank | No Schooling Completed |
| Ghanaians | 0.1 /100 | #274 | Tragic 2.6% |
| Immigrants | China | 0.1 /100 | #275 | Tragic 2.6% |
| Immigrants | Western Africa | 0.1 /100 | #276 | Tragic 2.6% |
| Immigrants | Philippines | 0.1 /100 | #277 | Tragic 2.6% |
| Immigrants | Uzbekistan | 0.1 /100 | #278 | Tragic 2.6% |
| Barbadians | 0.1 /100 | #279 | Tragic 2.6% |
| Trinidadians and Tobagonians | 0.1 /100 | #280 | Tragic 2.6% |
| Afghans | 0.1 /100 | #281 | Tragic 2.6% |
| Immigrants | Ghana | 0.1 /100 | #282 | Tragic 2.6% |
| Immigrants | Trinidad and Tobago | 0.0 /100 | #283 | Tragic 2.6% |
| Immigrants | West Indies | 0.0 /100 | #284 | Tragic 2.7% |
| Immigrants | Barbados | 0.0 /100 | #285 | Tragic 2.7% |
| Immigrants | Portugal | 0.0 /100 | #286 | Tragic 2.7% |
| Immigrants | Afghanistan | 0.0 /100 | #287 | Tragic 2.7% |
| Immigrants | St. Vincent and the Grenadines | 0.0 /100 | #288 | Tragic 2.7% |
| Immigrants | Thailand | 0.0 /100 | #289 | Tragic 2.7% |
| Immigrants | Hong Kong | 0.0 /100 | #290 | Tragic 2.7% |
| British West Indians | 0.0 /100 | #291 | Tragic 2.7% |
| Immigrants | Grenada | 0.0 /100 | #292 | Tragic 2.8% |
| Malaysians | 0.0 /100 | #293 | Tragic 2.8% |
| Immigrants | Eritrea | 0.0 /100 | #294 | Tragic 2.8% |