Icelander vs Immigrants from Grenada Median Male Earnings
COMPARE
Icelander
Immigrants from Grenada
Median Male Earnings
Median Male Earnings Comparison
Icelanders
Immigrants from Grenada
$55,415
MEDIAN MALE EARNINGS
71.2/ 100
METRIC RATING
157th/ 347
METRIC RANK
$50,279
MEDIAN MALE EARNINGS
1.6/ 100
METRIC RATING
251st/ 347
METRIC RANK
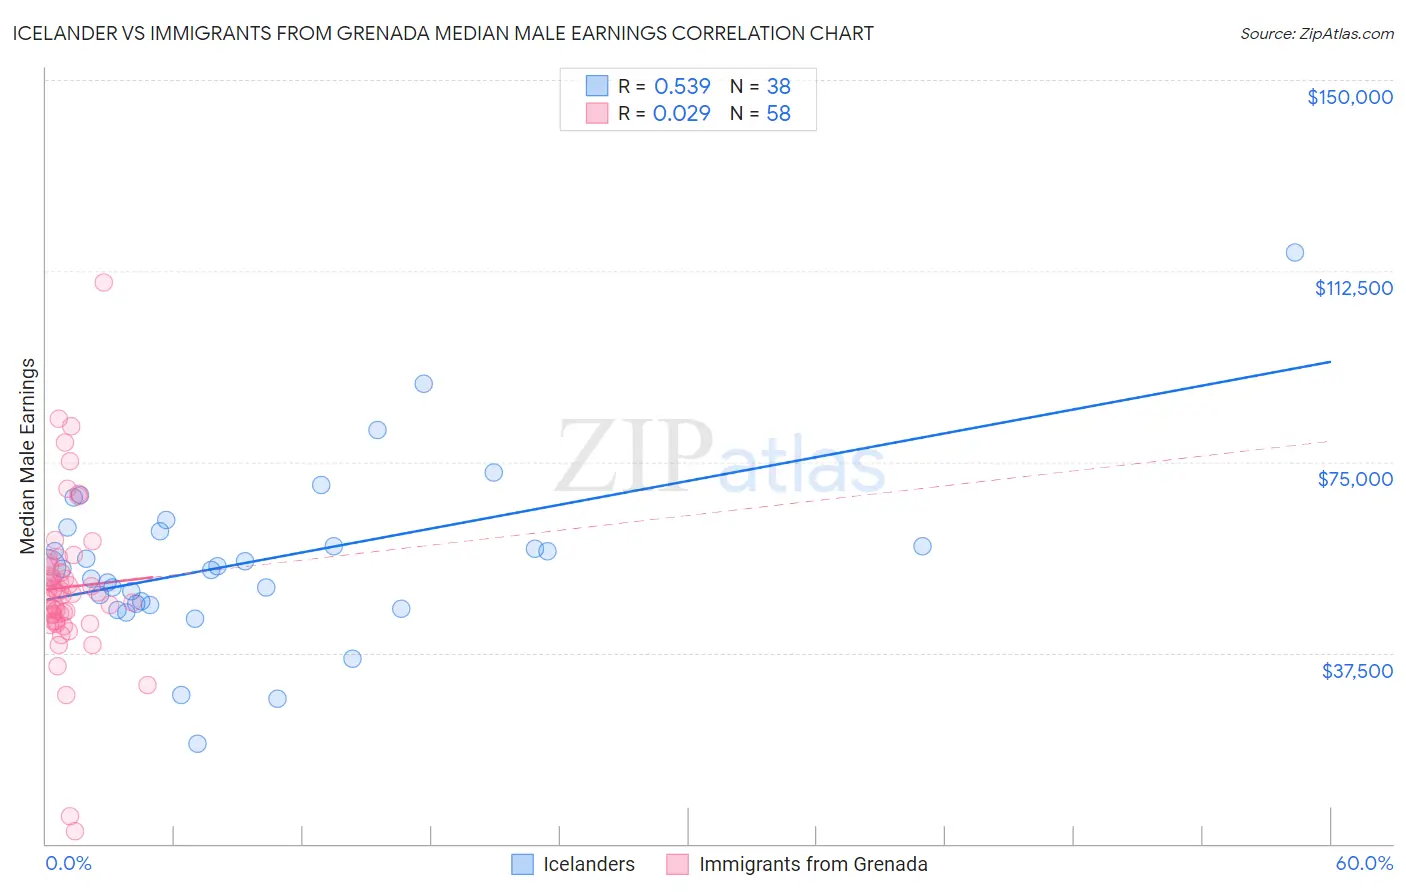
Icelander vs Immigrants from Grenada Median Male Earnings Correlation Chart
The statistical analysis conducted on geographies consisting of 159,653,287 people shows a substantial positive correlation between the proportion of Icelanders and median male earnings in the United States with a correlation coefficient (R) of 0.539 and weighted average of $55,415. Similarly, the statistical analysis conducted on geographies consisting of 67,198,306 people shows no correlation between the proportion of Immigrants from Grenada and median male earnings in the United States with a correlation coefficient (R) of 0.029 and weighted average of $50,279, a difference of 10.2%.
Median Male Earnings Correlation Summary
| Measurement | Icelander | Immigrants from Grenada |
| Minimum | $19,583 | $2,499 |
| Maximum | $116,188 | $110,313 |
| Range | $96,605 | $107,814 |
| Mean | $55,596 | $50,381 |
| Median | $54,221 | $49,246 |
| Interquartile 25% (IQ1) | $47,034 | $43,797 |
| Interquartile 75% (IQ3) | $61,435 | $54,582 |
| Interquartile Range (IQR) | $14,401 | $10,785 |
| Standard Deviation (Sample) | $16,814 | $16,114 |
| Standard Deviation (Population) | $16,591 | $15,975 |
Similar Demographics by Median Male Earnings
Demographics Similar to Icelanders by Median Male Earnings
In terms of median male earnings, the demographic groups most similar to Icelanders are Immigrants from Ethiopia ($55,434, a difference of 0.030%), Czechoslovakian ($55,382, a difference of 0.060%), Alsatian ($55,380, a difference of 0.060%), Basque ($55,370, a difference of 0.080%), and Belgian ($55,361, a difference of 0.10%).
| Demographics | Rating | Rank | Median Male Earnings |
| Swiss | 77.1 /100 | #150 | Good $55,731 |
| Immigrants | Oceania | 76.8 /100 | #151 | Good $55,712 |
| Peruvians | 75.8 /100 | #152 | Good $55,659 |
| Immigrants | Nepal | 75.0 /100 | #153 | Good $55,615 |
| Taiwanese | 73.9 /100 | #154 | Good $55,556 |
| Scandinavians | 73.4 /100 | #155 | Good $55,527 |
| Immigrants | Ethiopia | 71.6 /100 | #156 | Good $55,434 |
| Icelanders | 71.2 /100 | #157 | Good $55,415 |
| Czechoslovakians | 70.5 /100 | #158 | Good $55,382 |
| Alsatians | 70.5 /100 | #159 | Good $55,380 |
| Basques | 70.3 /100 | #160 | Good $55,370 |
| Belgians | 70.1 /100 | #161 | Good $55,361 |
| French | 69.9 /100 | #162 | Good $55,350 |
| Ugandans | 68.6 /100 | #163 | Good $55,290 |
| Immigrants | South Eastern Asia | 67.6 /100 | #164 | Good $55,241 |
Demographics Similar to Immigrants from Grenada by Median Male Earnings
In terms of median male earnings, the demographic groups most similar to Immigrants from Grenada are Osage ($50,292, a difference of 0.020%), Immigrants from Burma/Myanmar ($50,298, a difference of 0.040%), Immigrants from Guyana ($50,321, a difference of 0.080%), Subsaharan African ($50,408, a difference of 0.26%), and Immigrants from Ecuador ($50,474, a difference of 0.39%).
| Demographics | Rating | Rank | Median Male Earnings |
| Houma | 2.0 /100 | #244 | Tragic $50,547 |
| Hawaiians | 1.9 /100 | #245 | Tragic $50,488 |
| Immigrants | Ecuador | 1.9 /100 | #246 | Tragic $50,474 |
| Sub-Saharan Africans | 1.8 /100 | #247 | Tragic $50,408 |
| Immigrants | Guyana | 1.6 /100 | #248 | Tragic $50,321 |
| Immigrants | Burma/Myanmar | 1.6 /100 | #249 | Tragic $50,298 |
| Osage | 1.6 /100 | #250 | Tragic $50,292 |
| Immigrants | Grenada | 1.6 /100 | #251 | Tragic $50,279 |
| Immigrants | Cabo Verde | 1.2 /100 | #252 | Tragic $50,009 |
| German Russians | 1.1 /100 | #253 | Tragic $49,924 |
| Senegalese | 1.0 /100 | #254 | Tragic $49,774 |
| Alaskan Athabascans | 0.9 /100 | #255 | Tragic $49,748 |
| Alaska Natives | 0.9 /100 | #256 | Tragic $49,711 |
| British West Indians | 0.8 /100 | #257 | Tragic $49,636 |
| Cree | 0.7 /100 | #258 | Tragic $49,497 |