Panamanian vs Immigrants from Grenada No Schooling Completed
COMPARE
Panamanian
Immigrants from Grenada
No Schooling Completed
No Schooling Completed Comparison
Panamanians
Immigrants from Grenada
2.1%
NO SCHOOLING COMPLETED
45.2/ 100
METRIC RATING
176th/ 347
METRIC RANK
2.8%
NO SCHOOLING COMPLETED
0.0/ 100
METRIC RATING
292nd/ 347
METRIC RANK
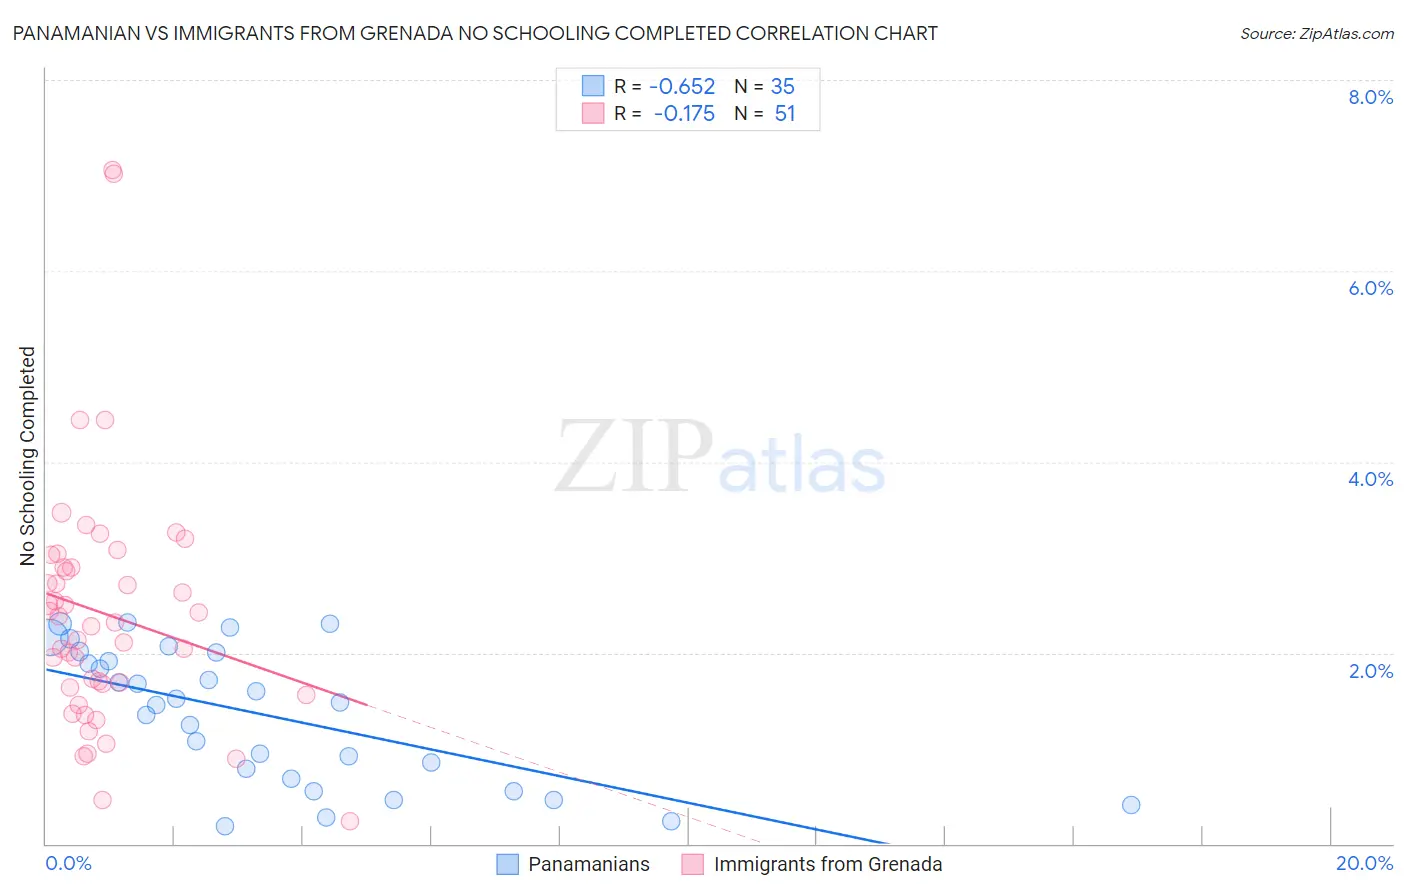
Panamanian vs Immigrants from Grenada No Schooling Completed Correlation Chart
The statistical analysis conducted on geographies consisting of 279,950,007 people shows a significant negative correlation between the proportion of Panamanians and percentage of population with no schooling in the United States with a correlation coefficient (R) of -0.652 and weighted average of 2.1%. Similarly, the statistical analysis conducted on geographies consisting of 67,145,019 people shows a poor negative correlation between the proportion of Immigrants from Grenada and percentage of population with no schooling in the United States with a correlation coefficient (R) of -0.175 and weighted average of 2.8%, a difference of 30.9%.
No Schooling Completed Correlation Summary
| Measurement | Panamanian | Immigrants from Grenada |
| Minimum | 0.18% | 0.24% |
| Maximum | 2.3% | 7.1% |
| Range | 2.1% | 6.8% |
| Mean | 1.4% | 2.4% |
| Median | 1.5% | 2.3% |
| Interquartile 25% (IQ1) | 0.68% | 1.6% |
| Interquartile 75% (IQ3) | 2.0% | 2.9% |
| Interquartile Range (IQR) | 1.3% | 1.3% |
| Standard Deviation (Sample) | 0.70% | 1.3% |
| Standard Deviation (Population) | 0.69% | 1.3% |
Similar Demographics by No Schooling Completed
Demographics Similar to Panamanians by No Schooling Completed
In terms of no schooling completed, the demographic groups most similar to Panamanians are Arapaho (2.1%, a difference of 0.020%), Pakistani (2.1%, a difference of 0.060%), Immigrants from Kazakhstan (2.1%, a difference of 0.11%), Arab (2.1%, a difference of 0.17%), and Portuguese (2.1%, a difference of 0.17%).
| Demographics | Rating | Rank | No Schooling Completed |
| Apache | 56.7 /100 | #169 | Average 2.1% |
| Argentineans | 56.0 /100 | #170 | Average 2.1% |
| Immigrants | Poland | 55.2 /100 | #171 | Average 2.1% |
| Immigrants | Argentina | 52.7 /100 | #172 | Average 2.1% |
| Immigrants | Belarus | 51.8 /100 | #173 | Average 2.1% |
| Immigrants | Micronesia | 50.0 /100 | #174 | Average 2.1% |
| Arabs | 46.4 /100 | #175 | Average 2.1% |
| Panamanians | 45.2 /100 | #176 | Average 2.1% |
| Arapaho | 45.0 /100 | #177 | Average 2.1% |
| Pakistanis | 44.7 /100 | #178 | Average 2.1% |
| Immigrants | Kazakhstan | 44.3 /100 | #179 | Average 2.1% |
| Portuguese | 43.9 /100 | #180 | Average 2.1% |
| Immigrants | Taiwan | 42.6 /100 | #181 | Average 2.1% |
| French American Indians | 42.2 /100 | #182 | Average 2.1% |
| Blacks/African Americans | 41.4 /100 | #183 | Average 2.1% |
Demographics Similar to Immigrants from Grenada by No Schooling Completed
In terms of no schooling completed, the demographic groups most similar to Immigrants from Grenada are Malaysian (2.8%, a difference of 0.41%), Immigrants from Eritrea (2.8%, a difference of 0.58%), British West Indian (2.7%, a difference of 1.1%), Houma (2.8%, a difference of 1.1%), and Immigrants (2.8%, a difference of 1.2%).
| Demographics | Rating | Rank | No Schooling Completed |
| Immigrants | Barbados | 0.0 /100 | #285 | Tragic 2.7% |
| Immigrants | Portugal | 0.0 /100 | #286 | Tragic 2.7% |
| Immigrants | Afghanistan | 0.0 /100 | #287 | Tragic 2.7% |
| Immigrants | St. Vincent and the Grenadines | 0.0 /100 | #288 | Tragic 2.7% |
| Immigrants | Thailand | 0.0 /100 | #289 | Tragic 2.7% |
| Immigrants | Hong Kong | 0.0 /100 | #290 | Tragic 2.7% |
| British West Indians | 0.0 /100 | #291 | Tragic 2.7% |
| Immigrants | Grenada | 0.0 /100 | #292 | Tragic 2.8% |
| Malaysians | 0.0 /100 | #293 | Tragic 2.8% |
| Immigrants | Eritrea | 0.0 /100 | #294 | Tragic 2.8% |
| Houma | 0.0 /100 | #295 | Tragic 2.8% |
| Immigrants | Immigrants | 0.0 /100 | #296 | Tragic 2.8% |
| Immigrants | Cuba | 0.0 /100 | #297 | Tragic 2.8% |
| Immigrants | Dominica | 0.0 /100 | #298 | Tragic 2.8% |
| Central American Indians | 0.0 /100 | #299 | Tragic 2.8% |