Guyanese vs Immigrants from Grenada No Schooling Completed
COMPARE
Guyanese
Immigrants from Grenada
No Schooling Completed
No Schooling Completed Comparison
Guyanese
Immigrants from Grenada
3.0%
NO SCHOOLING COMPLETED
0.0/ 100
METRIC RATING
310th/ 347
METRIC RANK
2.8%
NO SCHOOLING COMPLETED
0.0/ 100
METRIC RATING
292nd/ 347
METRIC RANK
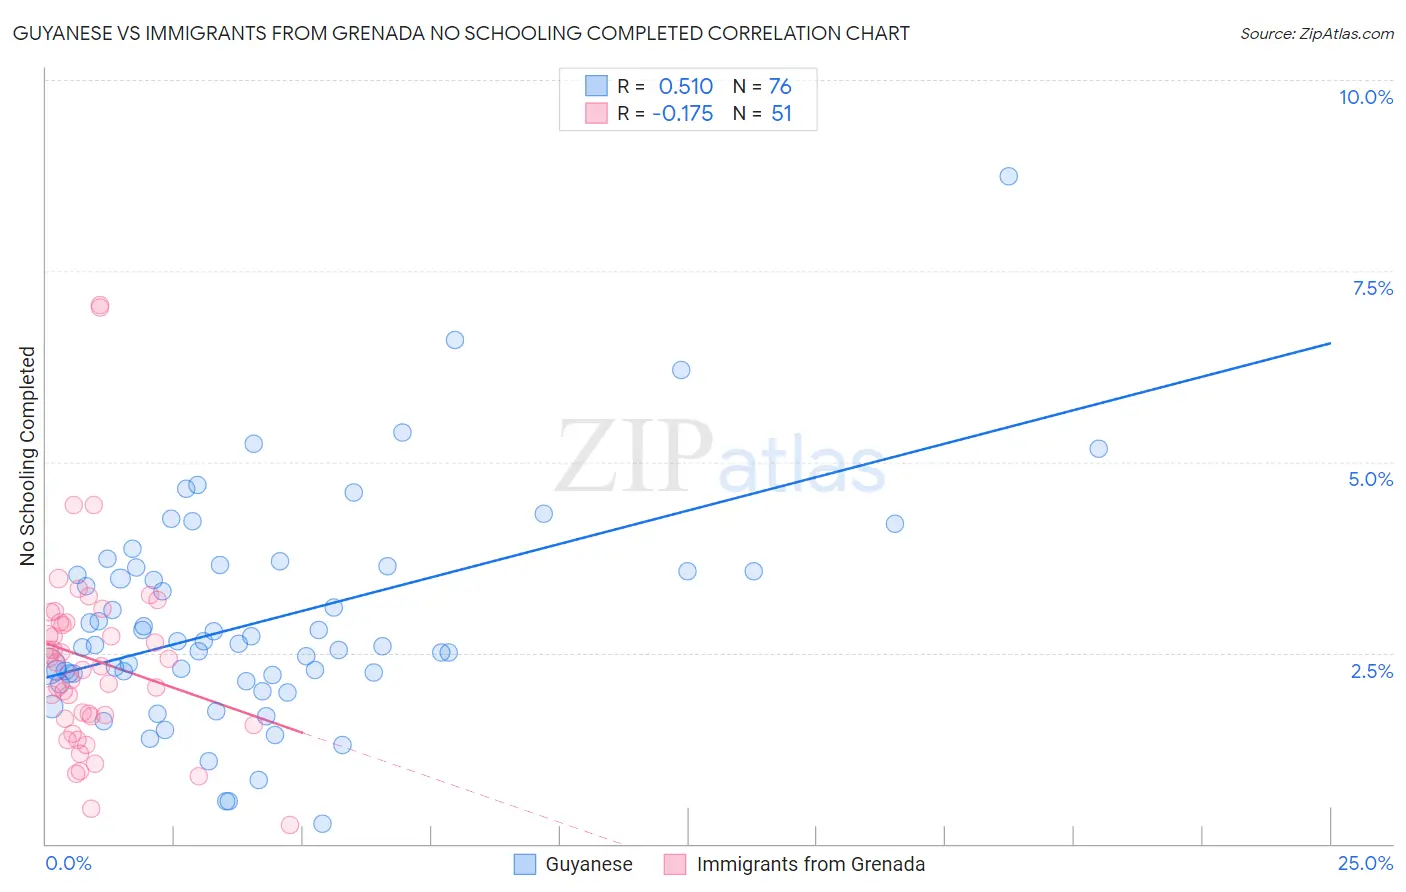
Guyanese vs Immigrants from Grenada No Schooling Completed Correlation Chart
The statistical analysis conducted on geographies consisting of 176,268,002 people shows a substantial positive correlation between the proportion of Guyanese and percentage of population with no schooling in the United States with a correlation coefficient (R) of 0.510 and weighted average of 3.0%. Similarly, the statistical analysis conducted on geographies consisting of 67,145,019 people shows a poor negative correlation between the proportion of Immigrants from Grenada and percentage of population with no schooling in the United States with a correlation coefficient (R) of -0.175 and weighted average of 2.8%, a difference of 10.2%.
No Schooling Completed Correlation Summary
| Measurement | Guyanese | Immigrants from Grenada |
| Minimum | 0.26% | 0.24% |
| Maximum | 8.7% | 7.1% |
| Range | 8.5% | 6.8% |
| Mean | 2.9% | 2.4% |
| Median | 2.6% | 2.3% |
| Interquartile 25% (IQ1) | 2.2% | 1.6% |
| Interquartile 75% (IQ3) | 3.6% | 2.9% |
| Interquartile Range (IQR) | 1.4% | 1.3% |
| Standard Deviation (Sample) | 1.4% | 1.3% |
| Standard Deviation (Population) | 1.4% | 1.3% |
Demographics Similar to Guyanese and Immigrants from Grenada by No Schooling Completed
In terms of no schooling completed, the demographic groups most similar to Guyanese are Hispanic or Latino (3.0%, a difference of 0.050%), Immigrants from the Azores (3.0%, a difference of 0.10%), Immigrants from Somalia (3.0%, a difference of 0.86%), Immigrants from Haiti (3.0%, a difference of 1.0%), and Belizean (3.0%, a difference of 1.1%). Similarly, the demographic groups most similar to Immigrants from Grenada are Malaysian (2.8%, a difference of 0.41%), Immigrants from Eritrea (2.8%, a difference of 0.58%), British West Indian (2.7%, a difference of 1.1%), Houma (2.8%, a difference of 1.1%), and Immigrants (2.8%, a difference of 1.2%).
| Demographics | Rating | Rank | No Schooling Completed |
| British West Indians | 0.0 /100 | #291 | Tragic 2.7% |
| Immigrants | Grenada | 0.0 /100 | #292 | Tragic 2.8% |
| Malaysians | 0.0 /100 | #293 | Tragic 2.8% |
| Immigrants | Eritrea | 0.0 /100 | #294 | Tragic 2.8% |
| Houma | 0.0 /100 | #295 | Tragic 2.8% |
| Immigrants | Immigrants | 0.0 /100 | #296 | Tragic 2.8% |
| Immigrants | Cuba | 0.0 /100 | #297 | Tragic 2.8% |
| Immigrants | Dominica | 0.0 /100 | #298 | Tragic 2.8% |
| Central American Indians | 0.0 /100 | #299 | Tragic 2.8% |
| Haitians | 0.0 /100 | #300 | Tragic 2.9% |
| Immigrants | South Eastern Asia | 0.0 /100 | #301 | Tragic 2.9% |
| Immigrants | Caribbean | 0.0 /100 | #302 | Tragic 2.9% |
| Somalis | 0.0 /100 | #303 | Tragic 2.9% |
| Nicaraguans | 0.0 /100 | #304 | Tragic 2.9% |
| Ecuadorians | 0.0 /100 | #305 | Tragic 3.0% |
| Belizeans | 0.0 /100 | #306 | Tragic 3.0% |
| Immigrants | Haiti | 0.0 /100 | #307 | Tragic 3.0% |
| Immigrants | Somalia | 0.0 /100 | #308 | Tragic 3.0% |
| Hispanics or Latinos | 0.0 /100 | #309 | Tragic 3.0% |
| Guyanese | 0.0 /100 | #310 | Tragic 3.0% |
| Immigrants | Azores | 0.0 /100 | #311 | Tragic 3.0% |