Hungarian vs Ugandan No Schooling Completed

COMPARE

Hungarian
Race
Ancestry
AfghanAfricanAlaska NativeAlaskan AthabascanAlbanianAleutAlsatianAmericanApacheArabArapahoArgentineanArmenianAssyrian/Chaldean/SyriacAustralianAustrianBahamianBangladeshiBarbadianBasqueBelgianBelizeanBermudanBhutaneseBlackfeetBolivianBrazilianBritishBritish West IndianBulgarianBurmeseCajunCambodianCanadianCape VerdeanCarpatho RusynCelticCentral AmericanCentral American IndianCherokeeCheyenneChickasawChileanChineseChippewaChoctawColombianColvilleComancheCosta RicanCreeCreekCroatianCrowCubanCypriotCzechCzechoslovakianDanishDelawareDominicanDutchDutch West IndianEastern EuropeanEcuadorianEgyptianEnglishEstonianEthiopianEuropeanFijianFilipinoFinnishFrenchFrench American IndianFrench CanadianGermanGerman RussianGhanaianGreekGuamanian/ChamorroGuatemalanGuyaneseHaitianHmongHonduranHopiHoumaHungarianIcelanderIndian (Asian)IndonesianInupiatIranianIraqiIrishIroquoisIsraeliItalianJamaicanJapaneseJordanianKenyanKiowaKoreanLaotianLatvianLebaneseLiberianLithuanianLumbeeLuxembourgerMacedonianMalaysianMalteseMarshalleseMenomineeMexicanMexican American IndianMongolianMoroccanNative HawaiianNavajoNepaleseNew ZealanderNicaraguanNigerianNorthern EuropeanNorwegianOkinawanOsageOttawaPaiutePakistaniPalestinianPanamanianParaguayanPennsylvania GermanPeruvianPimaPolishPortuguesePotawatomiPuebloPuerto RicanPuget Sound SalishRomanianRussianSalvadoranSamoanScandinavianScotch-IrishScottishSeminoleSenegaleseSerbianShoshoneSierra LeoneanSiouxSlavicSlovakSloveneSomaliSouth AfricanSouth AmericanSouth American IndianSoviet UnionSpaniardSpanishSpanish AmericanSpanish American IndianSri LankanSubsaharan AfricanSudaneseSwedishSwissSyrianTaiwaneseThaiTlingit-HaidaTohono O'OdhamTonganTrinidadian and TobagonianTsimshianTurkishU.S. Virgin IslanderUkrainianUruguayanUteVenezuelanVietnameseWelshWest IndianYakamaYaquiYugoslavianYumanYup'ikZimbabwean
Immigration
NonimmigrantsImmigrantsAfghanistanAfricaAlbaniaArgentinaArmeniaAsiaAustraliaAustriaBahamasBangladeshBarbadosBelarusBelgiumBelizeBoliviaBosnia and HerzegovinaBrazilBulgariaBurma/MyanmarCabo VerdeCambodiaCameroonCanadaCaribbeanCentral AmericaChileChinaColombiaCongoCosta RicaCroatiaCubaCzechoslovakiaDenmarkDominicaDominican RepublicEastern AfricaEastern AsiaEastern EuropeEcuadorEgyptEl SalvadorEnglandEritreaEthiopiaEuropeFijiFranceGermanyGhanaGreeceGrenadaGuatemalaGuyanaHaitiHondurasHong KongHungaryIndiaIndonesiaIranIraqIrelandIsraelItalyJamaicaJapanJordanKazakhstanKenyaKoreaKuwaitLaosLatin AmericaLatviaLebanonLiberiaLithuaniaMalaysiaMexicoMicronesiaMiddle AfricaMoldovaMoroccoNepalNetherlandsNicaraguaNigeriaNorth AmericaNorth MacedoniaNorthern AfricaNorthern EuropeNorwayOceaniaPakistanPanamaPeruPhilippinesPolandPortugalRomaniaRussiaSaudi ArabiaScotlandSenegalSerbiaSierra LeoneSingaporeSomaliaSouth AfricaSouth AmericaSouth Central AsiaSouth Eastern AsiaSouthern EuropeSpainSri LankaSt. Vincent and the GrenadinesSudanSwedenSwitzerlandSyriaTaiwanThailandTrinidad and TobagoTurkeyUgandaUkraineUruguayUzbekistanVenezuelaVietnamWest IndiesWestern AfricaWestern AsiaWestern EuropeYemenZaireZimbabweAzores
Ugandan
Race
Ancestry
AfghanAfricanAlaska NativeAlaskan AthabascanAlbanianAleutAlsatianAmericanApacheArabArapahoArgentineanArmenianAssyrian/Chaldean/SyriacAustralianAustrianBahamianBangladeshiBarbadianBasqueBelgianBelizeanBermudanBhutaneseBlackfeetBolivianBrazilianBritishBritish West IndianBulgarianBurmeseCajunCambodianCanadianCape VerdeanCarpatho RusynCelticCentral AmericanCentral American IndianCherokeeCheyenneChickasawChileanChineseChippewaChoctawColombianColvilleComancheCosta RicanCreeCreekCroatianCrowCubanCypriotCzechCzechoslovakianDanishDelawareDominicanDutchDutch West IndianEastern EuropeanEcuadorianEgyptianEnglishEstonianEthiopianEuropeanFijianFilipinoFinnishFrenchFrench American IndianFrench CanadianGermanGerman RussianGhanaianGreekGuamanian/ChamorroGuatemalanGuyaneseHaitianHmongHonduranHopiHoumaIcelanderIndian (Asian)IndonesianInupiatIranianIraqiIrishIroquoisIsraeliItalianJamaicanJapaneseJordanianKenyanKiowaKoreanLaotianLatvianLebaneseLiberianLithuanianLumbeeLuxembourgerMacedonianMalaysianMalteseMarshalleseMenomineeMexicanMexican American IndianMongolianMoroccanNative HawaiianNavajoNepaleseNew ZealanderNicaraguanNigerianNorthern EuropeanNorwegianOkinawanOsageOttawaPaiutePakistaniPalestinianPanamanianParaguayanPennsylvania GermanPeruvianPimaPolishPortuguesePotawatomiPuebloPuerto RicanPuget Sound SalishRomanianRussianSalvadoranSamoanScandinavianScotch-IrishScottishSeminoleSenegaleseSerbianShoshoneSierra LeoneanSiouxSlavicSlovakSloveneSomaliSouth AfricanSouth AmericanSouth American IndianSoviet UnionSpaniardSpanishSpanish AmericanSpanish American IndianSri LankanSubsaharan AfricanSudaneseSwedishSwissSyrianTaiwaneseThaiTlingit-HaidaTohono O'OdhamTonganTrinidadian and TobagonianTsimshianTurkishU.S. Virgin IslanderUgandanUkrainianUruguayanUteVenezuelanVietnameseWelshWest IndianYakamaYaquiYugoslavianYumanYup'ikZimbabwean
Immigration
NonimmigrantsImmigrantsAfghanistanAfricaAlbaniaArgentinaArmeniaAsiaAustraliaAustriaBahamasBangladeshBarbadosBelarusBelgiumBelizeBoliviaBosnia and HerzegovinaBrazilBulgariaBurma/MyanmarCabo VerdeCambodiaCameroonCanadaCaribbeanCentral AmericaChileChinaColombiaCongoCosta RicaCroatiaCubaCzechoslovakiaDenmarkDominicaDominican RepublicEastern AfricaEastern AsiaEastern EuropeEcuadorEgyptEl SalvadorEnglandEritreaEthiopiaEuropeFijiFranceGermanyGhanaGreeceGrenadaGuatemalaGuyanaHaitiHondurasHong KongHungaryIndiaIndonesiaIranIraqIrelandIsraelItalyJamaicaJapanJordanKazakhstanKenyaKoreaKuwaitLaosLatin AmericaLatviaLebanonLiberiaLithuaniaMalaysiaMexicoMicronesiaMiddle AfricaMoldovaMoroccoNepalNetherlandsNicaraguaNigeriaNorth AmericaNorth MacedoniaNorthern AfricaNorthern EuropeNorwayOceaniaPakistanPanamaPeruPhilippinesPolandPortugalRomaniaRussiaSaudi ArabiaScotlandSenegalSerbiaSierra LeoneSingaporeSomaliaSouth AfricaSouth AmericaSouth Central AsiaSouth Eastern AsiaSouthern EuropeSpainSri LankaSt. Vincent and the GrenadinesSudanSwedenSwitzerlandSyriaTaiwanThailandTrinidad and TobagoTurkeyUgandaUkraineUruguayUzbekistanVenezuelaVietnamWest IndiesWestern AfricaWestern AsiaWestern EuropeYemenZaireZimbabweAzores
No Schooling Completed
Income
Poverty
Unemployment
Labor Participation
Family Structure
Vehicle Availability
Education Level
Disability

No Schooling Completed Comparison

Hungarians

Ugandans

Exceptional
Good
1.6%
NO SCHOOLING COMPLETED
99.9/ 100
METRIC RATING
41st/ 347
METRIC RANK
2.0%
NO SCHOOLING COMPLETED
64.6/ 100
METRIC RATING
161st/ 347
METRIC RANK

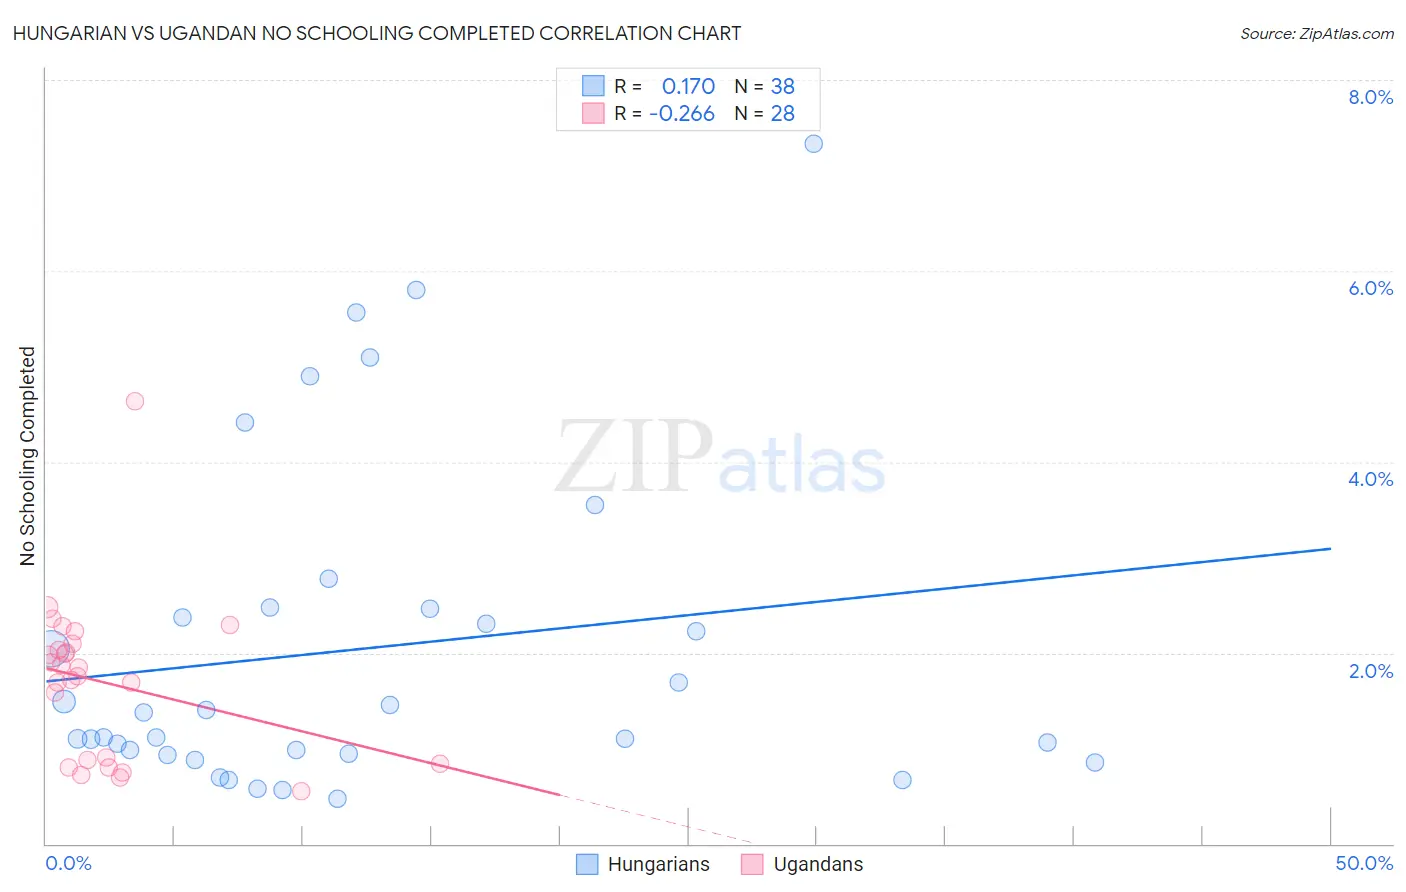
Hungarian vs Ugandan No Schooling Completed Correlation Chart

The statistical analysis conducted on geographies consisting of 476,473,790 people shows a poor positive correlation between the proportion of Hungarians and percentage of population with no schooling in the United States with a correlation coefficient (R) of 0.170 and weighted average of 1.6%. Similarly, the statistical analysis conducted on geographies consisting of 93,762,117 people shows a weak negative correlation between the proportion of Ugandans and percentage of population with no schooling in the United States with a correlation coefficient (R) of -0.266 and weighted average of 2.0%, a difference of 28.6%.
Hungarian vs Ugandan No Schooling Completed

No Schooling Completed Correlation Summary

MeasurementHungarianUgandan
Minimum0.47%0.56%
Maximum7.3%4.6%
Range6.9%4.1%
Mean2.0%1.7%
Median1.2%1.8%
Interquartile 25% (IQ1)0.94%0.85%
Interquartile 75% (IQ3)2.5%2.1%
Interquartile Range (IQR)1.5%1.2%
Standard Deviation (Sample)1.7%0.84%
Standard Deviation (Population)1.7%0.83%

Similar Demographics by No Schooling Completed

Demographics Similar to Hungarians by No Schooling Completed

In terms of no schooling completed, the demographic groups most similar to Hungarians are Luxembourger (1.6%, a difference of 0.27%), Native Hawaiian (1.6%, a difference of 0.62%), Northern European (1.6%, a difference of 0.89%), Belgian (1.6%, a difference of 1.0%), and Aleut (1.6%, a difference of 1.3%).
DemographicsRating | RankNo Schooling Completed
Latvians
100.0
/100
|
#34
Exceptional
1.5%
Eastern Europeans
100.0
/100
|
#35
Exceptional
1.6%
Aleuts
99.9
/100
|
#36
Exceptional
1.6%
Belgians
99.9
/100
|
#37
Exceptional
1.6%
Northern Europeans
99.9
/100
|
#38
Exceptional
1.6%
Native Hawaiians
99.9
/100
|
#39
Exceptional
1.6%
Luxembourgers
99.9
/100
|
#40
Exceptional
1.6%
Hungarians
99.9
/100
|
#41
Exceptional
1.6%
Bulgarians
99.9
/100
|
#42
Exceptional
1.6%
Australians
99.9
/100
|
#43
Exceptional
1.6%
Estonians
99.9
/100
|
#44
Exceptional
1.6%
Czechoslovakians
99.9
/100
|
#45
Exceptional
1.6%
Maltese
99.9
/100
|
#46
Exceptional
1.6%
Ottawa
99.9
/100
|
#47
Exceptional
1.6%
Immigrants | Scotland
99.9
/100
|
#48
Exceptional
1.6%

Demographics Similar to Ugandans by No Schooling Completed

In terms of no schooling completed, the demographic groups most similar to Ugandans are Immigrants from Brazil (2.1%, a difference of 0.11%), Kenyan (2.0%, a difference of 0.17%), Immigrants from Spain (2.0%, a difference of 0.29%), Immigrants from Korea (2.0%, a difference of 0.33%), and Albanian (2.1%, a difference of 0.35%).
DemographicsRating | RankNo Schooling Completed
Immigrants | Venezuela
68.5
/100
|
#154
Good
2.0%
Immigrants | Russia
67.6
/100
|
#155
Good
2.0%
Chileans
67.2
/100
|
#156
Good
2.0%
Immigrants | Sri Lanka
67.0
/100
|
#157
Good
2.0%
Immigrants | Korea
66.7
/100
|
#158
Good
2.0%
Immigrants | Spain
66.4
/100
|
#159
Good
2.0%
Kenyans
65.7
/100
|
#160
Good
2.0%
Ugandans
64.6
/100
|
#161
Good
2.0%
Immigrants | Brazil
63.8
/100
|
#162
Good
2.1%
Albanians
62.2
/100
|
#163
Good
2.1%
Comanche
60.7
/100
|
#164
Good
2.1%
Brazilians
60.2
/100
|
#165
Good
2.1%
Dutch West Indians
59.9
/100
|
#166
Average
2.1%
Egyptians
59.2
/100
|
#167
Average
2.1%
Cheyenne
58.6
/100
|
#168
Average
2.1%