Hungarian vs Indonesian No Schooling Completed
COMPARE
Hungarian
Indonesian
No Schooling Completed
No Schooling Completed Comparison
Hungarians
Indonesians
1.6%
NO SCHOOLING COMPLETED
99.9/ 100
METRIC RATING
41st/ 347
METRIC RANK
3.2%
NO SCHOOLING COMPLETED
0.0/ 100
METRIC RATING
326th/ 347
METRIC RANK
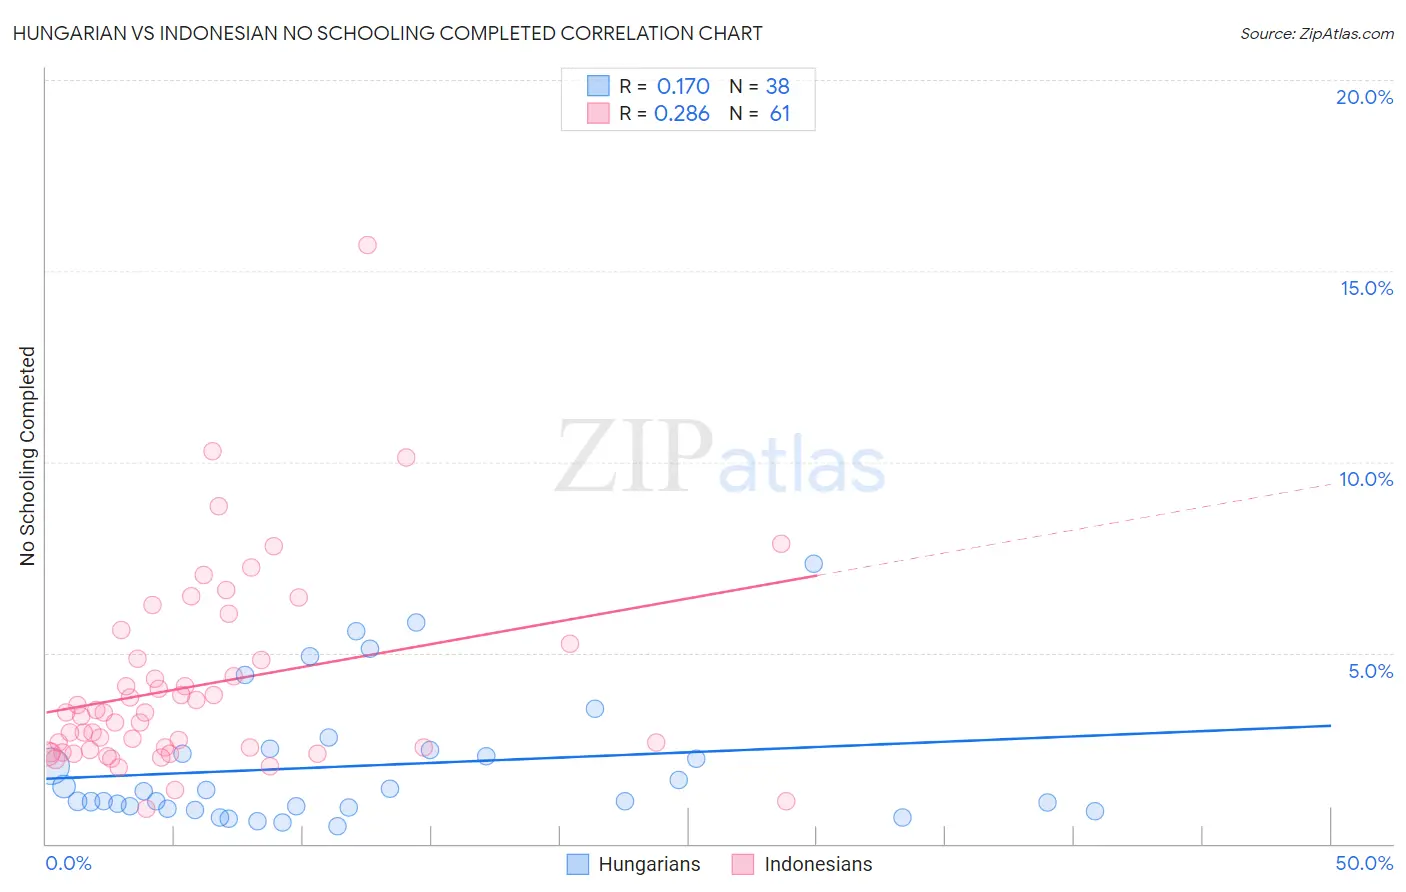
Hungarian vs Indonesian No Schooling Completed Correlation Chart
The statistical analysis conducted on geographies consisting of 476,473,790 people shows a poor positive correlation between the proportion of Hungarians and percentage of population with no schooling in the United States with a correlation coefficient (R) of 0.170 and weighted average of 1.6%. Similarly, the statistical analysis conducted on geographies consisting of 162,153,140 people shows a weak positive correlation between the proportion of Indonesians and percentage of population with no schooling in the United States with a correlation coefficient (R) of 0.286 and weighted average of 3.2%, a difference of 101.5%.
No Schooling Completed Correlation Summary
| Measurement | Hungarian | Indonesian |
| Minimum | 0.47% | 0.92% |
| Maximum | 7.3% | 15.7% |
| Range | 6.9% | 14.8% |
| Mean | 2.0% | 4.2% |
| Median | 1.2% | 3.4% |
| Interquartile 25% (IQ1) | 0.94% | 2.4% |
| Interquartile 75% (IQ3) | 2.5% | 5.0% |
| Interquartile Range (IQR) | 1.5% | 2.6% |
| Standard Deviation (Sample) | 1.7% | 2.6% |
| Standard Deviation (Population) | 1.7% | 2.6% |
Similar Demographics by No Schooling Completed
Demographics Similar to Hungarians by No Schooling Completed
In terms of no schooling completed, the demographic groups most similar to Hungarians are Luxembourger (1.6%, a difference of 0.27%), Native Hawaiian (1.6%, a difference of 0.62%), Northern European (1.6%, a difference of 0.89%), Belgian (1.6%, a difference of 1.0%), and Aleut (1.6%, a difference of 1.3%).
| Demographics | Rating | Rank | No Schooling Completed |
| Latvians | 100.0 /100 | #34 | Exceptional 1.5% |
| Eastern Europeans | 100.0 /100 | #35 | Exceptional 1.6% |
| Aleuts | 99.9 /100 | #36 | Exceptional 1.6% |
| Belgians | 99.9 /100 | #37 | Exceptional 1.6% |
| Northern Europeans | 99.9 /100 | #38 | Exceptional 1.6% |
| Native Hawaiians | 99.9 /100 | #39 | Exceptional 1.6% |
| Luxembourgers | 99.9 /100 | #40 | Exceptional 1.6% |
| Hungarians | 99.9 /100 | #41 | Exceptional 1.6% |
| Bulgarians | 99.9 /100 | #42 | Exceptional 1.6% |
| Australians | 99.9 /100 | #43 | Exceptional 1.6% |
| Estonians | 99.9 /100 | #44 | Exceptional 1.6% |
| Czechoslovakians | 99.9 /100 | #45 | Exceptional 1.6% |
| Maltese | 99.9 /100 | #46 | Exceptional 1.6% |
| Ottawa | 99.9 /100 | #47 | Exceptional 1.6% |
| Immigrants | Scotland | 99.9 /100 | #48 | Exceptional 1.6% |
Demographics Similar to Indonesians by No Schooling Completed
In terms of no schooling completed, the demographic groups most similar to Indonesians are Dominican (3.2%, a difference of 0.030%), Mexican American Indian (3.2%, a difference of 0.70%), Vietnamese (3.2%, a difference of 1.1%), Immigrants from Honduras (3.2%, a difference of 1.2%), and Immigrants from Laos (3.1%, a difference of 1.9%).
| Demographics | Rating | Rank | No Schooling Completed |
| Immigrants | Burma/Myanmar | 0.0 /100 | #319 | Tragic 3.1% |
| Immigrants | Bangladesh | 0.0 /100 | #320 | Tragic 3.1% |
| Immigrants | Laos | 0.0 /100 | #321 | Tragic 3.1% |
| Immigrants | Honduras | 0.0 /100 | #322 | Tragic 3.2% |
| Vietnamese | 0.0 /100 | #323 | Tragic 3.2% |
| Mexican American Indians | 0.0 /100 | #324 | Tragic 3.2% |
| Dominicans | 0.0 /100 | #325 | Tragic 3.2% |
| Indonesians | 0.0 /100 | #326 | Tragic 3.2% |
| Immigrants | Latin America | 0.0 /100 | #327 | Tragic 3.3% |
| Mexicans | 0.0 /100 | #328 | Tragic 3.3% |
| Immigrants | Vietnam | 0.0 /100 | #329 | Tragic 3.3% |
| Immigrants | Armenia | 0.0 /100 | #330 | Tragic 3.3% |
| Japanese | 0.0 /100 | #331 | Tragic 3.3% |
| Central Americans | 0.0 /100 | #332 | Tragic 3.4% |
| Immigrants | Dominican Republic | 0.0 /100 | #333 | Tragic 3.4% |