Hungarian vs Ugandan 9th Grade
COMPARE
Hungarian
Ugandan
9th Grade
9th Grade Comparison
Hungarians
Ugandans
96.2%
9TH GRADE
100.0/ 100
METRIC RATING
34th/ 347
METRIC RANK
95.1%
9TH GRADE
77.0/ 100
METRIC RATING
152nd/ 347
METRIC RANK
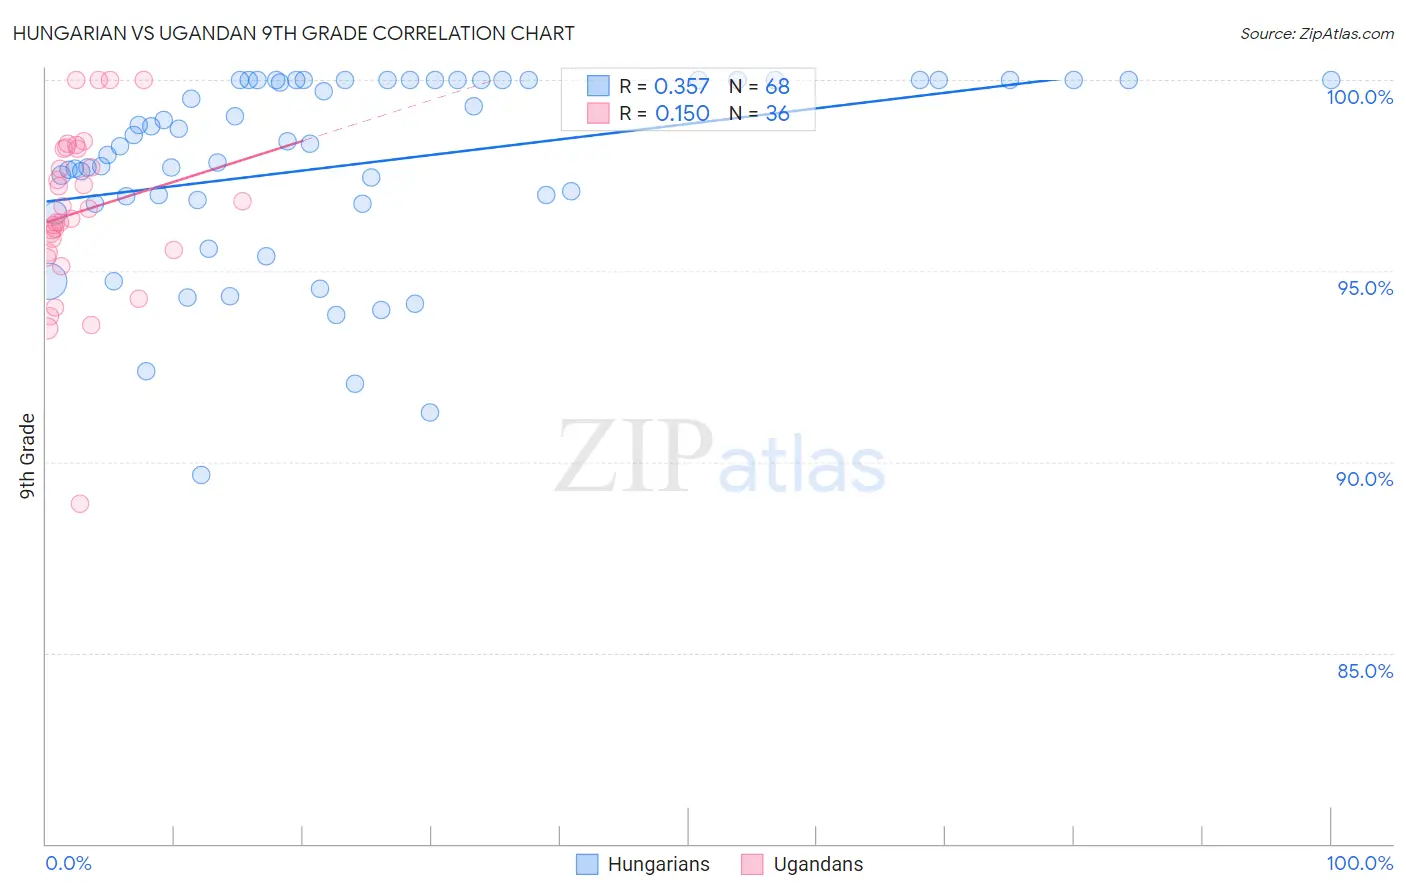
Hungarian vs Ugandan 9th Grade Correlation Chart
The statistical analysis conducted on geographies consisting of 486,239,439 people shows a mild positive correlation between the proportion of Hungarians and percentage of population with at least 9th grade education in the United States with a correlation coefficient (R) of 0.357 and weighted average of 96.2%. Similarly, the statistical analysis conducted on geographies consisting of 93,991,892 people shows a poor positive correlation between the proportion of Ugandans and percentage of population with at least 9th grade education in the United States with a correlation coefficient (R) of 0.150 and weighted average of 95.1%, a difference of 1.2%.
9th Grade Correlation Summary
| Measurement | Hungarian | Ugandan |
| Minimum | 89.7% | 88.9% |
| Maximum | 100.0% | 100.0% |
| Range | 10.3% | 11.1% |
| Mean | 97.8% | 96.6% |
| Median | 98.4% | 96.5% |
| Interquartile 25% (IQ1) | 96.8% | 95.5% |
| Interquartile 75% (IQ3) | 100.0% | 98.2% |
| Interquartile Range (IQR) | 3.2% | 2.7% |
| Standard Deviation (Sample) | 2.5% | 2.2% |
| Standard Deviation (Population) | 2.5% | 2.2% |
Similar Demographics by 9th Grade
Demographics Similar to Hungarians by 9th Grade
In terms of 9th grade, the demographic groups most similar to Hungarians are Luxembourger (96.3%, a difference of 0.030%), British (96.3%, a difference of 0.040%), Belgian (96.3%, a difference of 0.040%), Bulgarian (96.2%, a difference of 0.040%), and Northern European (96.2%, a difference of 0.040%).
| Demographics | Rating | Rank | 9th Grade |
| Scotch-Irish | 100.0 /100 | #27 | Exceptional 96.3% |
| Eastern Europeans | 100.0 /100 | #28 | Exceptional 96.3% |
| Chinese | 100.0 /100 | #29 | Exceptional 96.3% |
| Maltese | 100.0 /100 | #30 | Exceptional 96.3% |
| British | 100.0 /100 | #31 | Exceptional 96.3% |
| Belgians | 100.0 /100 | #32 | Exceptional 96.3% |
| Luxembourgers | 100.0 /100 | #33 | Exceptional 96.3% |
| Hungarians | 100.0 /100 | #34 | Exceptional 96.2% |
| Bulgarians | 99.9 /100 | #35 | Exceptional 96.2% |
| Northern Europeans | 99.9 /100 | #36 | Exceptional 96.2% |
| Estonians | 99.9 /100 | #37 | Exceptional 96.1% |
| Immigrants | Scotland | 99.9 /100 | #38 | Exceptional 96.1% |
| Ottawa | 99.9 /100 | #39 | Exceptional 96.1% |
| Slavs | 99.9 /100 | #40 | Exceptional 96.1% |
| Czechoslovakians | 99.9 /100 | #41 | Exceptional 96.1% |
Demographics Similar to Ugandans by 9th Grade
In terms of 9th grade, the demographic groups most similar to Ugandans are Cajun (95.1%, a difference of 0.0%), Albanian (95.1%, a difference of 0.010%), Kenyan (95.1%, a difference of 0.020%), Arab (95.1%, a difference of 0.020%), and Immigrants from Kazakhstan (95.1%, a difference of 0.020%).
| Demographics | Rating | Rank | 9th Grade |
| Pueblo | 82.2 /100 | #145 | Excellent 95.1% |
| Immigrants | Sri Lanka | 82.1 /100 | #146 | Excellent 95.1% |
| Choctaw | 81.9 /100 | #147 | Excellent 95.1% |
| Immigrants | Jordan | 81.2 /100 | #148 | Excellent 95.1% |
| Immigrants | Korea | 79.6 /100 | #149 | Good 95.1% |
| Kenyans | 79.1 /100 | #150 | Good 95.1% |
| Cajuns | 77.3 /100 | #151 | Good 95.1% |
| Ugandans | 77.0 /100 | #152 | Good 95.1% |
| Albanians | 76.1 /100 | #153 | Good 95.1% |
| Arabs | 74.9 /100 | #154 | Good 95.1% |
| Immigrants | Kazakhstan | 74.7 /100 | #155 | Good 95.1% |
| Immigrants | Kenya | 73.1 /100 | #156 | Good 95.0% |
| Mongolians | 73.0 /100 | #157 | Good 95.0% |
| Egyptians | 70.1 /100 | #158 | Good 95.0% |
| Immigrants | Ukraine | 67.4 /100 | #159 | Good 95.0% |