Hungarian vs Immigrants from Norway No Schooling Completed
COMPARE
Hungarian
Immigrants from Norway
No Schooling Completed
No Schooling Completed Comparison
Hungarians
Immigrants from Norway
1.6%
NO SCHOOLING COMPLETED
99.9/ 100
METRIC RATING
41st/ 347
METRIC RANK
1.9%
NO SCHOOLING COMPLETED
96.1/ 100
METRIC RATING
114th/ 347
METRIC RANK
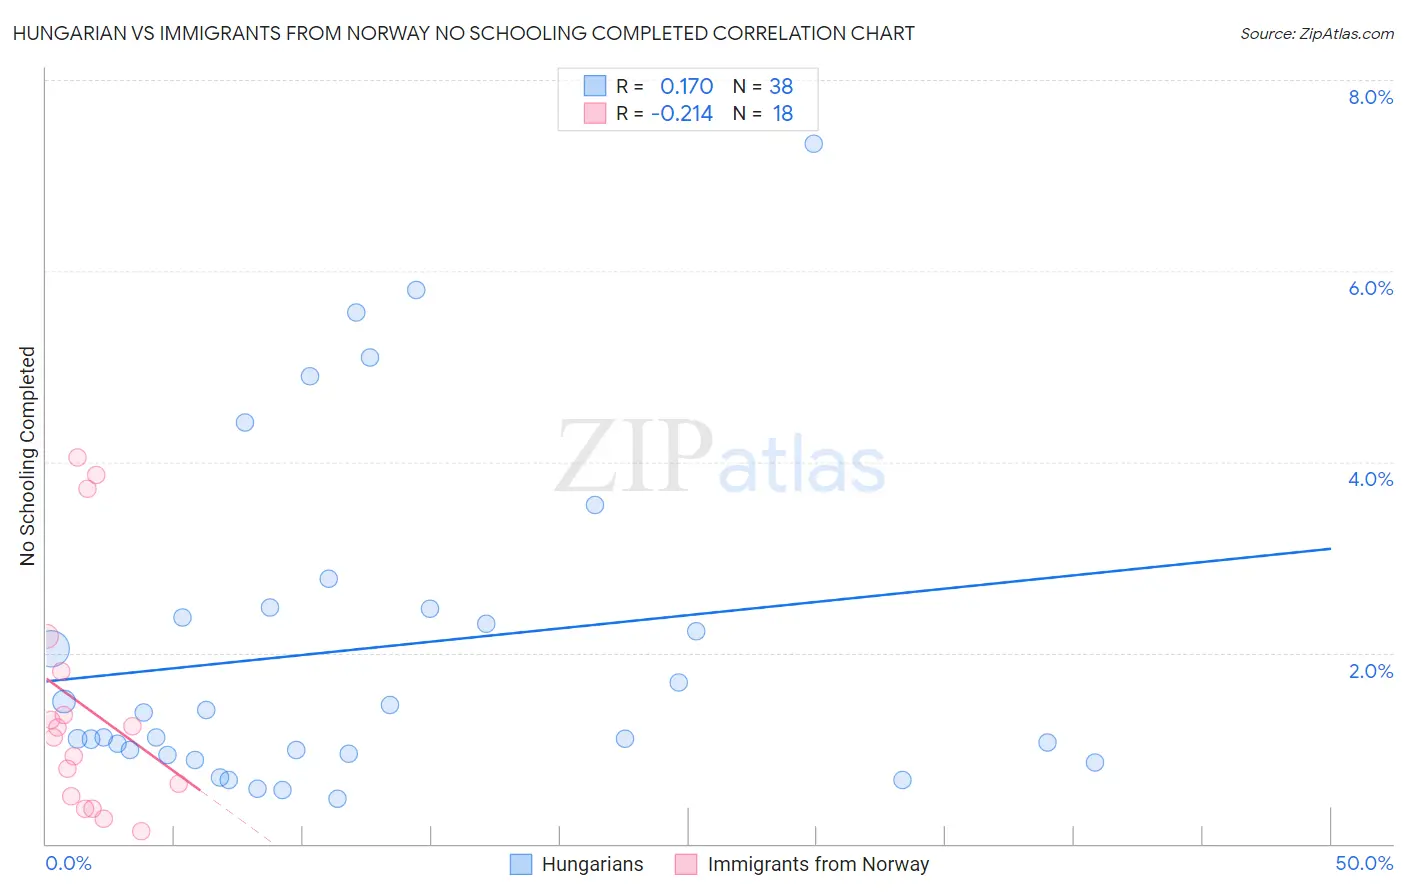
Hungarian vs Immigrants from Norway No Schooling Completed Correlation Chart
The statistical analysis conducted on geographies consisting of 476,473,790 people shows a poor positive correlation between the proportion of Hungarians and percentage of population with no schooling in the United States with a correlation coefficient (R) of 0.170 and weighted average of 1.6%. Similarly, the statistical analysis conducted on geographies consisting of 116,062,009 people shows a weak negative correlation between the proportion of Immigrants from Norway and percentage of population with no schooling in the United States with a correlation coefficient (R) of -0.214 and weighted average of 1.9%, a difference of 17.1%.
No Schooling Completed Correlation Summary
| Measurement | Hungarian | Immigrants from Norway |
| Minimum | 0.47% | 0.13% |
| Maximum | 7.3% | 4.0% |
| Range | 6.9% | 3.9% |
| Mean | 2.0% | 1.4% |
| Median | 1.2% | 1.2% |
| Interquartile 25% (IQ1) | 0.94% | 0.50% |
| Interquartile 75% (IQ3) | 2.5% | 1.8% |
| Interquartile Range (IQR) | 1.5% | 1.3% |
| Standard Deviation (Sample) | 1.7% | 1.2% |
| Standard Deviation (Population) | 1.7% | 1.2% |
Similar Demographics by No Schooling Completed
Demographics Similar to Hungarians by No Schooling Completed
In terms of no schooling completed, the demographic groups most similar to Hungarians are Luxembourger (1.6%, a difference of 0.27%), Native Hawaiian (1.6%, a difference of 0.62%), Northern European (1.6%, a difference of 0.89%), Belgian (1.6%, a difference of 1.0%), and Aleut (1.6%, a difference of 1.3%).
| Demographics | Rating | Rank | No Schooling Completed |
| Latvians | 100.0 /100 | #34 | Exceptional 1.5% |
| Eastern Europeans | 100.0 /100 | #35 | Exceptional 1.6% |
| Aleuts | 99.9 /100 | #36 | Exceptional 1.6% |
| Belgians | 99.9 /100 | #37 | Exceptional 1.6% |
| Northern Europeans | 99.9 /100 | #38 | Exceptional 1.6% |
| Native Hawaiians | 99.9 /100 | #39 | Exceptional 1.6% |
| Luxembourgers | 99.9 /100 | #40 | Exceptional 1.6% |
| Hungarians | 99.9 /100 | #41 | Exceptional 1.6% |
| Bulgarians | 99.9 /100 | #42 | Exceptional 1.6% |
| Australians | 99.9 /100 | #43 | Exceptional 1.6% |
| Estonians | 99.9 /100 | #44 | Exceptional 1.6% |
| Czechoslovakians | 99.9 /100 | #45 | Exceptional 1.6% |
| Maltese | 99.9 /100 | #46 | Exceptional 1.6% |
| Ottawa | 99.9 /100 | #47 | Exceptional 1.6% |
| Immigrants | Scotland | 99.9 /100 | #48 | Exceptional 1.6% |
Demographics Similar to Immigrants from Norway by No Schooling Completed
In terms of no schooling completed, the demographic groups most similar to Immigrants from Norway are Immigrants from Zimbabwe (1.9%, a difference of 0.010%), Syrian (1.9%, a difference of 0.13%), Lebanese (1.9%, a difference of 0.15%), Pueblo (1.9%, a difference of 0.25%), and Immigrants from Serbia (1.9%, a difference of 0.35%).
| Demographics | Rating | Rank | No Schooling Completed |
| Yugoslavians | 97.2 /100 | #107 | Exceptional 1.8% |
| Okinawans | 97.1 /100 | #108 | Exceptional 1.8% |
| Immigrants | Saudi Arabia | 96.8 /100 | #109 | Exceptional 1.9% |
| Immigrants | Latvia | 96.7 /100 | #110 | Exceptional 1.9% |
| Immigrants | Japan | 96.6 /100 | #111 | Exceptional 1.9% |
| Pueblo | 96.4 /100 | #112 | Exceptional 1.9% |
| Immigrants | Zimbabwe | 96.2 /100 | #113 | Exceptional 1.9% |
| Immigrants | Norway | 96.1 /100 | #114 | Exceptional 1.9% |
| Syrians | 96.0 /100 | #115 | Exceptional 1.9% |
| Lebanese | 96.0 /100 | #116 | Exceptional 1.9% |
| Immigrants | Serbia | 95.8 /100 | #117 | Exceptional 1.9% |
| Spanish | 95.5 /100 | #118 | Exceptional 1.9% |
| Iroquois | 95.1 /100 | #119 | Exceptional 1.9% |
| Immigrants | Bulgaria | 94.6 /100 | #120 | Exceptional 1.9% |
| Immigrants | Croatia | 94.5 /100 | #121 | Exceptional 1.9% |