Hungarian vs Immigrants from Dominican Republic No Schooling Completed
COMPARE
Hungarian
Immigrants from Dominican Republic
No Schooling Completed
No Schooling Completed Comparison
Hungarians
Immigrants from Dominican Republic
1.6%
NO SCHOOLING COMPLETED
99.9/ 100
METRIC RATING
41st/ 347
METRIC RANK
3.4%
NO SCHOOLING COMPLETED
0.0/ 100
METRIC RATING
333rd/ 347
METRIC RANK
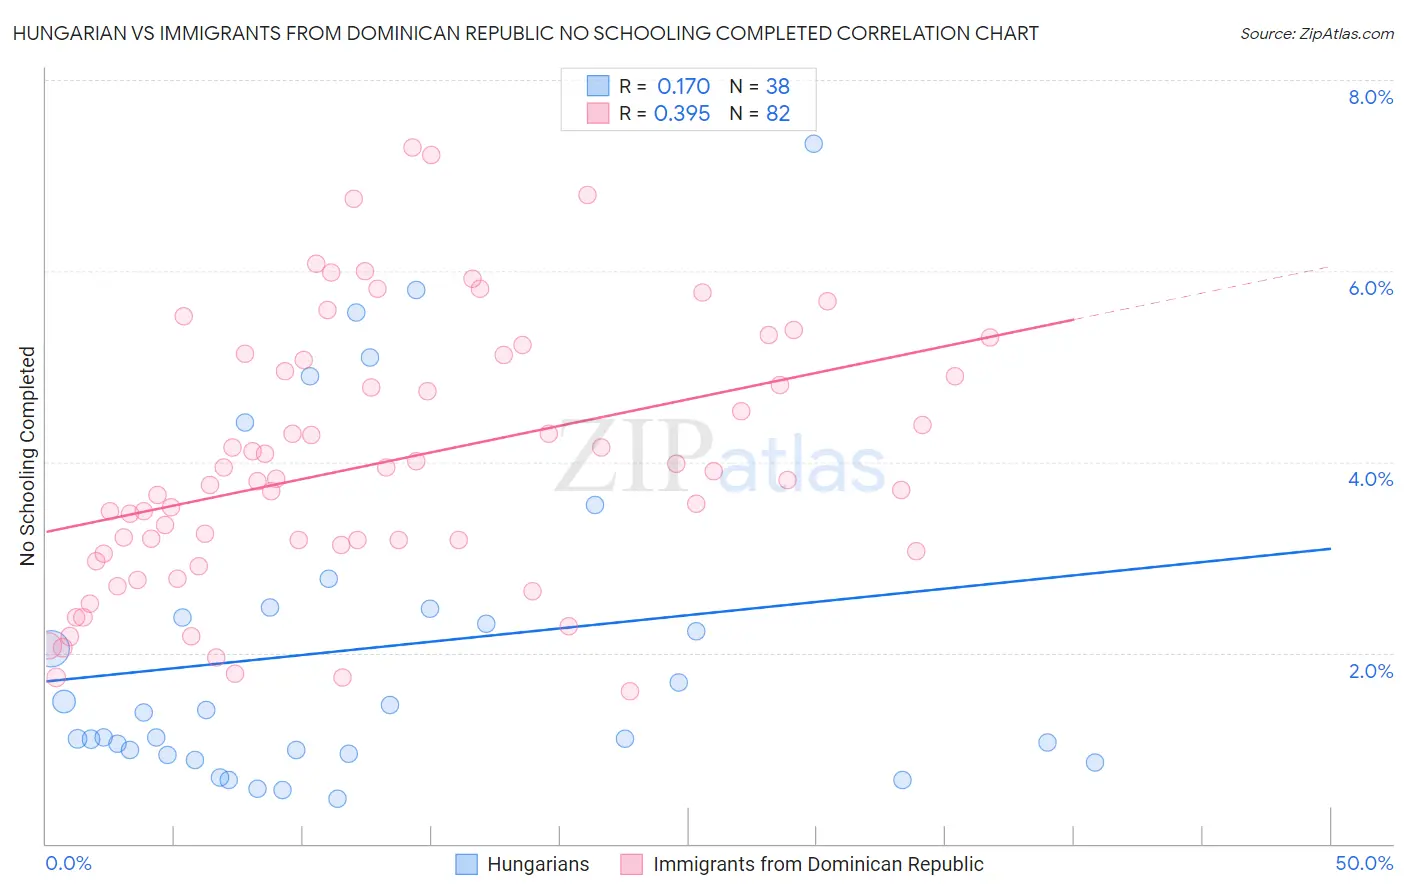
Hungarian vs Immigrants from Dominican Republic No Schooling Completed Correlation Chart
The statistical analysis conducted on geographies consisting of 476,473,790 people shows a poor positive correlation between the proportion of Hungarians and percentage of population with no schooling in the United States with a correlation coefficient (R) of 0.170 and weighted average of 1.6%. Similarly, the statistical analysis conducted on geographies consisting of 273,675,959 people shows a mild positive correlation between the proportion of Immigrants from Dominican Republic and percentage of population with no schooling in the United States with a correlation coefficient (R) of 0.395 and weighted average of 3.4%, a difference of 113.4%.
No Schooling Completed Correlation Summary
| Measurement | Hungarian | Immigrants from Dominican Republic |
| Minimum | 0.47% | 1.6% |
| Maximum | 7.3% | 7.3% |
| Range | 6.9% | 5.7% |
| Mean | 2.0% | 4.0% |
| Median | 1.2% | 3.8% |
| Interquartile 25% (IQ1) | 0.94% | 3.1% |
| Interquartile 75% (IQ3) | 2.5% | 5.1% |
| Interquartile Range (IQR) | 1.5% | 2.0% |
| Standard Deviation (Sample) | 1.7% | 1.4% |
| Standard Deviation (Population) | 1.7% | 1.4% |
Similar Demographics by No Schooling Completed
Demographics Similar to Hungarians by No Schooling Completed
In terms of no schooling completed, the demographic groups most similar to Hungarians are Luxembourger (1.6%, a difference of 0.27%), Native Hawaiian (1.6%, a difference of 0.62%), Northern European (1.6%, a difference of 0.89%), Belgian (1.6%, a difference of 1.0%), and Aleut (1.6%, a difference of 1.3%).
| Demographics | Rating | Rank | No Schooling Completed |
| Latvians | 100.0 /100 | #34 | Exceptional 1.5% |
| Eastern Europeans | 100.0 /100 | #35 | Exceptional 1.6% |
| Aleuts | 99.9 /100 | #36 | Exceptional 1.6% |
| Belgians | 99.9 /100 | #37 | Exceptional 1.6% |
| Northern Europeans | 99.9 /100 | #38 | Exceptional 1.6% |
| Native Hawaiians | 99.9 /100 | #39 | Exceptional 1.6% |
| Luxembourgers | 99.9 /100 | #40 | Exceptional 1.6% |
| Hungarians | 99.9 /100 | #41 | Exceptional 1.6% |
| Bulgarians | 99.9 /100 | #42 | Exceptional 1.6% |
| Australians | 99.9 /100 | #43 | Exceptional 1.6% |
| Estonians | 99.9 /100 | #44 | Exceptional 1.6% |
| Czechoslovakians | 99.9 /100 | #45 | Exceptional 1.6% |
| Maltese | 99.9 /100 | #46 | Exceptional 1.6% |
| Ottawa | 99.9 /100 | #47 | Exceptional 1.6% |
| Immigrants | Scotland | 99.9 /100 | #48 | Exceptional 1.6% |
Demographics Similar to Immigrants from Dominican Republic by No Schooling Completed
In terms of no schooling completed, the demographic groups most similar to Immigrants from Dominican Republic are Central American (3.4%, a difference of 0.060%), Japanese (3.3%, a difference of 1.6%), Immigrants from Armenia (3.3%, a difference of 1.6%), Guatemalan (3.5%, a difference of 1.8%), and Immigrants from Vietnam (3.3%, a difference of 2.0%).
| Demographics | Rating | Rank | No Schooling Completed |
| Indonesians | 0.0 /100 | #326 | Tragic 3.2% |
| Immigrants | Latin America | 0.0 /100 | #327 | Tragic 3.3% |
| Mexicans | 0.0 /100 | #328 | Tragic 3.3% |
| Immigrants | Vietnam | 0.0 /100 | #329 | Tragic 3.3% |
| Immigrants | Armenia | 0.0 /100 | #330 | Tragic 3.3% |
| Japanese | 0.0 /100 | #331 | Tragic 3.3% |
| Central Americans | 0.0 /100 | #332 | Tragic 3.4% |
| Immigrants | Dominican Republic | 0.0 /100 | #333 | Tragic 3.4% |
| Guatemalans | 0.0 /100 | #334 | Tragic 3.5% |
| Immigrants | Cambodia | 0.0 /100 | #335 | Tragic 3.5% |
| Immigrants | Fiji | 0.0 /100 | #336 | Tragic 3.5% |
| Immigrants | Cabo Verde | 0.0 /100 | #337 | Tragic 3.5% |
| Bangladeshis | 0.0 /100 | #338 | Tragic 3.5% |
| Yakama | 0.0 /100 | #339 | Tragic 3.6% |
| Immigrants | Guatemala | 0.0 /100 | #340 | Tragic 3.6% |