Hungarian vs Ugandan Poverty
COMPARE
Hungarian
Ugandan
Poverty
Poverty Comparison
Hungarians
Ugandans
12.2%
POVERTY
63.6/ 100
METRIC RATING
155th/ 347
METRIC RANK
13.1%
POVERTY
6.2/ 100
METRIC RATING
208th/ 347
METRIC RANK
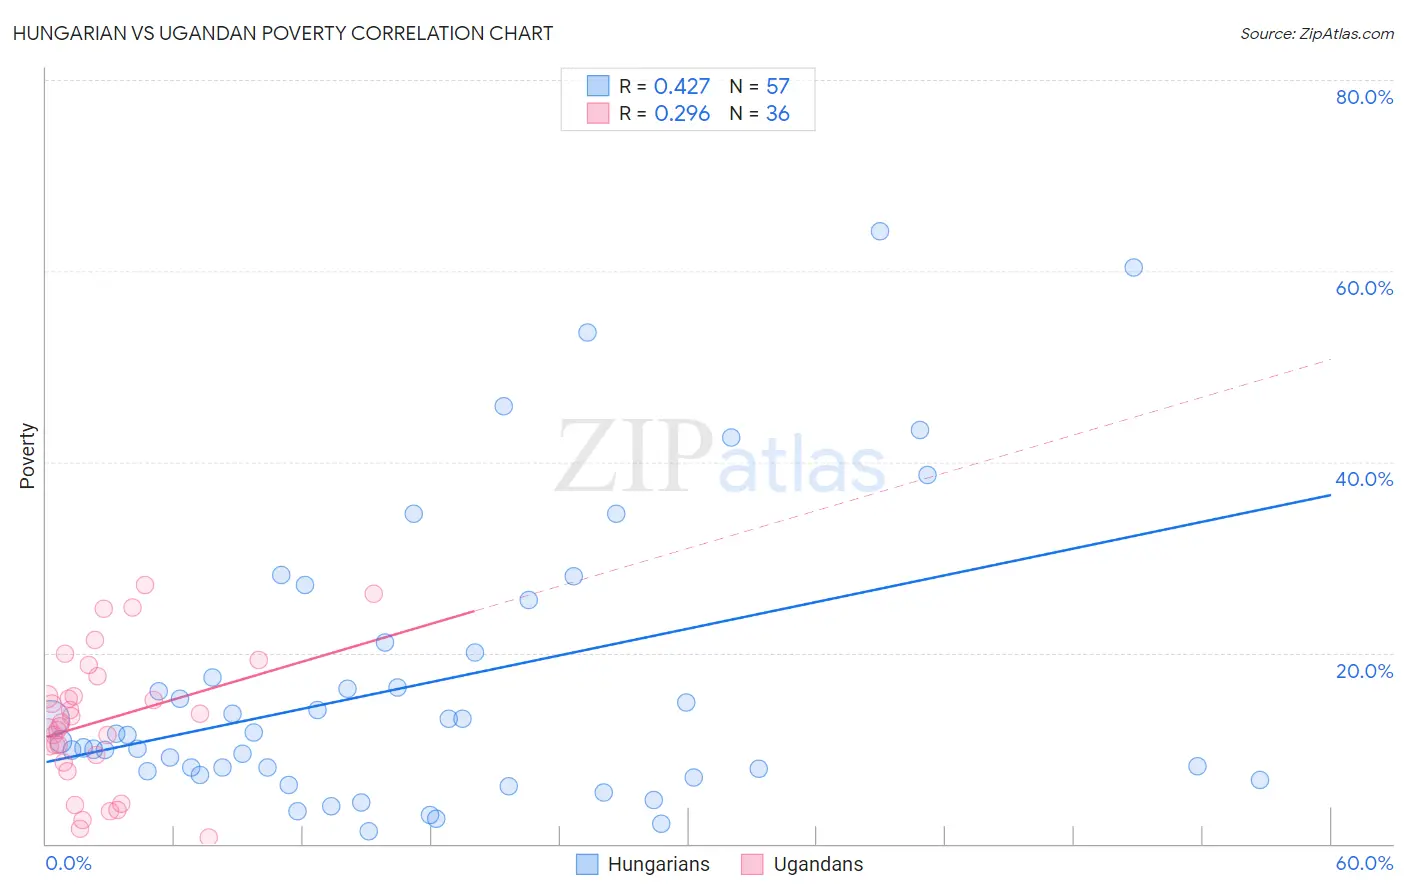
Hungarian vs Ugandan Poverty Correlation Chart
The statistical analysis conducted on geographies consisting of 485,863,259 people shows a moderate positive correlation between the proportion of Hungarians and poverty level in the United States with a correlation coefficient (R) of 0.427 and weighted average of 12.2%. Similarly, the statistical analysis conducted on geographies consisting of 93,996,476 people shows a weak positive correlation between the proportion of Ugandans and poverty level in the United States with a correlation coefficient (R) of 0.296 and weighted average of 13.1%, a difference of 8.0%.
Poverty Correlation Summary
| Measurement | Hungarian | Ugandan |
| Minimum | 1.3% | 0.63% |
| Maximum | 64.2% | 27.1% |
| Range | 62.9% | 26.5% |
| Mean | 16.8% | 12.9% |
| Median | 11.3% | 12.5% |
| Interquartile 25% (IQ1) | 7.4% | 8.9% |
| Interquartile 75% (IQ3) | 20.5% | 16.5% |
| Interquartile Range (IQR) | 13.1% | 7.6% |
| Standard Deviation (Sample) | 14.9% | 7.0% |
| Standard Deviation (Population) | 14.8% | 6.9% |
Similar Demographics by Poverty
Demographics Similar to Hungarians by Poverty
In terms of poverty, the demographic groups most similar to Hungarians are Guamanian/Chamorro (12.1%, a difference of 0.020%), Immigrants from Northern Africa (12.1%, a difference of 0.030%), Scotch-Irish (12.2%, a difference of 0.11%), Costa Rican (12.2%, a difference of 0.15%), and Taiwanese (12.2%, a difference of 0.19%).
| Demographics | Rating | Rank | Poverty |
| Immigrants | Germany | 72.7 /100 | #148 | Good 12.0% |
| Immigrants | Malaysia | 72.7 /100 | #149 | Good 12.0% |
| Immigrants | Kazakhstan | 72.3 /100 | #150 | Good 12.0% |
| Samoans | 71.9 /100 | #151 | Good 12.0% |
| Armenians | 67.6 /100 | #152 | Good 12.1% |
| Immigrants | Northern Africa | 63.9 /100 | #153 | Good 12.1% |
| Guamanians/Chamorros | 63.9 /100 | #154 | Good 12.1% |
| Hungarians | 63.6 /100 | #155 | Good 12.2% |
| Scotch-Irish | 62.6 /100 | #156 | Good 12.2% |
| Costa Ricans | 62.2 /100 | #157 | Good 12.2% |
| Taiwanese | 61.8 /100 | #158 | Good 12.2% |
| Pennsylvania Germans | 60.8 /100 | #159 | Good 12.2% |
| Immigrants | Nepal | 60.4 /100 | #160 | Good 12.2% |
| Immigrants | Fiji | 59.1 /100 | #161 | Average 12.2% |
| Ethiopians | 59.1 /100 | #162 | Average 12.2% |
Demographics Similar to Ugandans by Poverty
In terms of poverty, the demographic groups most similar to Ugandans are Malaysian (13.1%, a difference of 0.030%), Immigrants from the Azores (13.1%, a difference of 0.060%), Panamanian (13.1%, a difference of 0.15%), Immigrants from Eastern Africa (13.1%, a difference of 0.27%), and Moroccan (13.2%, a difference of 0.42%).
| Demographics | Rating | Rank | Poverty |
| Immigrants | Uganda | 16.5 /100 | #201 | Poor 12.8% |
| Immigrants | Uruguay | 15.6 /100 | #202 | Poor 12.8% |
| Hmong | 15.0 /100 | #203 | Poor 12.8% |
| Immigrants | Western Asia | 14.1 /100 | #204 | Poor 12.9% |
| Tsimshian | 9.2 /100 | #205 | Tragic 13.0% |
| Immigrants | Eastern Africa | 7.0 /100 | #206 | Tragic 13.1% |
| Panamanians | 6.6 /100 | #207 | Tragic 13.1% |
| Ugandans | 6.2 /100 | #208 | Tragic 13.1% |
| Malaysians | 6.1 /100 | #209 | Tragic 13.1% |
| Immigrants | Azores | 6.1 /100 | #210 | Tragic 13.1% |
| Moroccans | 5.2 /100 | #211 | Tragic 13.2% |
| Immigrants | Immigrants | 4.3 /100 | #212 | Tragic 13.2% |
| Immigrants | Panama | 4.1 /100 | #213 | Tragic 13.3% |
| Bermudans | 3.7 /100 | #214 | Tragic 13.3% |
| Japanese | 3.3 /100 | #215 | Tragic 13.3% |