Hungarian vs Immigrants from Denmark No Schooling Completed
COMPARE
Hungarian
Immigrants from Denmark
No Schooling Completed
No Schooling Completed Comparison
Hungarians
Immigrants from Denmark
1.6%
NO SCHOOLING COMPLETED
99.9/ 100
METRIC RATING
41st/ 347
METRIC RANK
1.7%
NO SCHOOLING COMPLETED
99.2/ 100
METRIC RATING
84th/ 347
METRIC RANK
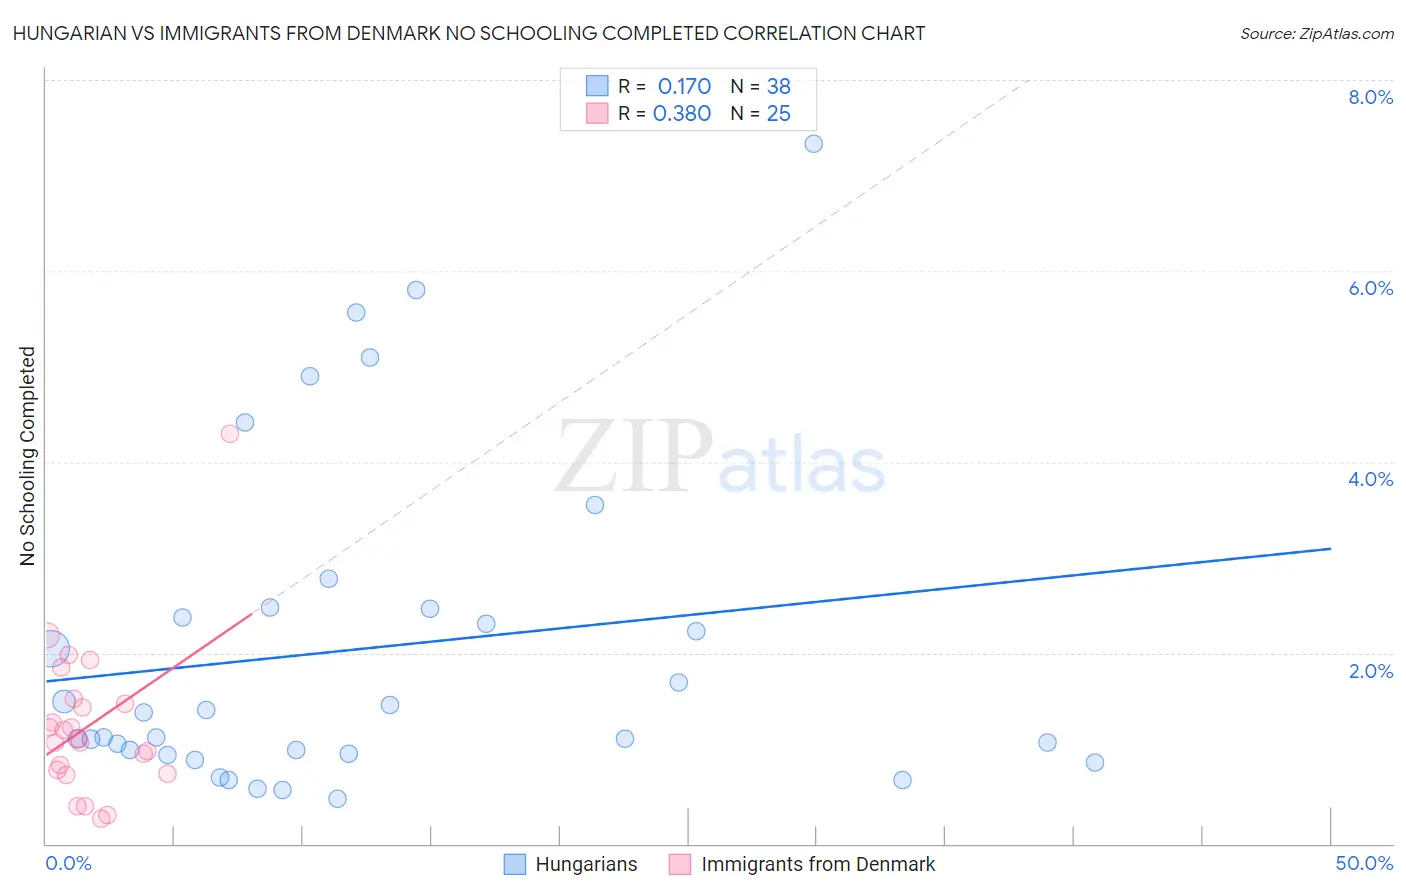
Hungarian vs Immigrants from Denmark No Schooling Completed Correlation Chart
The statistical analysis conducted on geographies consisting of 476,473,790 people shows a poor positive correlation between the proportion of Hungarians and percentage of population with no schooling in the United States with a correlation coefficient (R) of 0.170 and weighted average of 1.6%. Similarly, the statistical analysis conducted on geographies consisting of 135,590,094 people shows a mild positive correlation between the proportion of Immigrants from Denmark and percentage of population with no schooling in the United States with a correlation coefficient (R) of 0.380 and weighted average of 1.7%, a difference of 9.8%.
No Schooling Completed Correlation Summary
| Measurement | Hungarian | Immigrants from Denmark |
| Minimum | 0.47% | 0.27% |
| Maximum | 7.3% | 4.3% |
| Range | 6.9% | 4.0% |
| Mean | 2.0% | 1.2% |
| Median | 1.2% | 1.1% |
| Interquartile 25% (IQ1) | 0.94% | 0.75% |
| Interquartile 75% (IQ3) | 2.5% | 1.5% |
| Interquartile Range (IQR) | 1.5% | 0.74% |
| Standard Deviation (Sample) | 1.7% | 0.82% |
| Standard Deviation (Population) | 1.7% | 0.80% |
Similar Demographics by No Schooling Completed
Demographics Similar to Hungarians by No Schooling Completed
In terms of no schooling completed, the demographic groups most similar to Hungarians are Luxembourger (1.6%, a difference of 0.27%), Native Hawaiian (1.6%, a difference of 0.62%), Northern European (1.6%, a difference of 0.89%), Belgian (1.6%, a difference of 1.0%), and Aleut (1.6%, a difference of 1.3%).
| Demographics | Rating | Rank | No Schooling Completed |
| Latvians | 100.0 /100 | #34 | Exceptional 1.5% |
| Eastern Europeans | 100.0 /100 | #35 | Exceptional 1.6% |
| Aleuts | 99.9 /100 | #36 | Exceptional 1.6% |
| Belgians | 99.9 /100 | #37 | Exceptional 1.6% |
| Northern Europeans | 99.9 /100 | #38 | Exceptional 1.6% |
| Native Hawaiians | 99.9 /100 | #39 | Exceptional 1.6% |
| Luxembourgers | 99.9 /100 | #40 | Exceptional 1.6% |
| Hungarians | 99.9 /100 | #41 | Exceptional 1.6% |
| Bulgarians | 99.9 /100 | #42 | Exceptional 1.6% |
| Australians | 99.9 /100 | #43 | Exceptional 1.6% |
| Estonians | 99.9 /100 | #44 | Exceptional 1.6% |
| Czechoslovakians | 99.9 /100 | #45 | Exceptional 1.6% |
| Maltese | 99.9 /100 | #46 | Exceptional 1.6% |
| Ottawa | 99.9 /100 | #47 | Exceptional 1.6% |
| Immigrants | Scotland | 99.9 /100 | #48 | Exceptional 1.6% |
Demographics Similar to Immigrants from Denmark by No Schooling Completed
In terms of no schooling completed, the demographic groups most similar to Immigrants from Denmark are Immigrants from Australia (1.7%, a difference of 0.040%), Potawatomi (1.7%, a difference of 0.050%), Ukrainian (1.8%, a difference of 0.090%), Immigrants from South Africa (1.7%, a difference of 0.16%), and Icelander (1.7%, a difference of 0.25%).
| Demographics | Rating | Rank | No Schooling Completed |
| Immigrants | Sweden | 99.3 /100 | #77 | Exceptional 1.7% |
| Delaware | 99.3 /100 | #78 | Exceptional 1.7% |
| Macedonians | 99.3 /100 | #79 | Exceptional 1.7% |
| Cypriots | 99.3 /100 | #80 | Exceptional 1.7% |
| Icelanders | 99.3 /100 | #81 | Exceptional 1.7% |
| Immigrants | South Africa | 99.3 /100 | #82 | Exceptional 1.7% |
| Potawatomi | 99.3 /100 | #83 | Exceptional 1.7% |
| Immigrants | Denmark | 99.2 /100 | #84 | Exceptional 1.7% |
| Immigrants | Australia | 99.2 /100 | #85 | Exceptional 1.7% |
| Ukrainians | 99.2 /100 | #86 | Exceptional 1.8% |
| Osage | 99.2 /100 | #87 | Exceptional 1.8% |
| Immigrants | Western Europe | 99.2 /100 | #88 | Exceptional 1.8% |
| South Africans | 99.1 /100 | #89 | Exceptional 1.8% |
| Sioux | 99.0 /100 | #90 | Exceptional 1.8% |
| Immigrants | Germany | 99.0 /100 | #91 | Exceptional 1.8% |