Syrian vs Ugandan No Schooling Completed
COMPARE
Syrian
Ugandan
No Schooling Completed
No Schooling Completed Comparison
Syrians
Ugandans
1.9%
NO SCHOOLING COMPLETED
96.0/ 100
METRIC RATING
115th/ 347
METRIC RANK
2.0%
NO SCHOOLING COMPLETED
64.6/ 100
METRIC RATING
161st/ 347
METRIC RANK
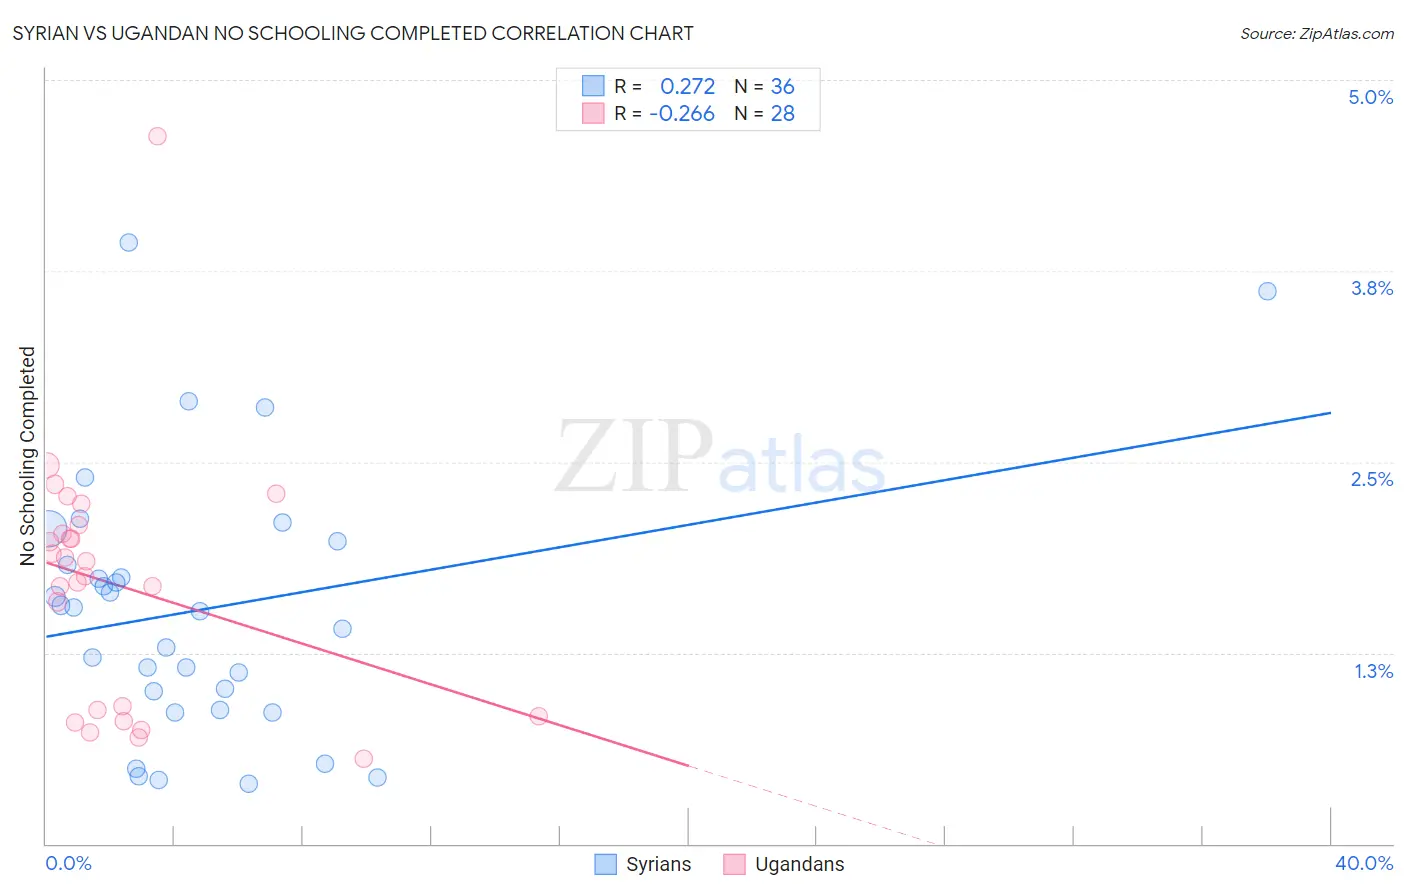
Syrian vs Ugandan No Schooling Completed Correlation Chart
The statistical analysis conducted on geographies consisting of 264,321,115 people shows a weak positive correlation between the proportion of Syrians and percentage of population with no schooling in the United States with a correlation coefficient (R) of 0.272 and weighted average of 1.9%. Similarly, the statistical analysis conducted on geographies consisting of 93,762,117 people shows a weak negative correlation between the proportion of Ugandans and percentage of population with no schooling in the United States with a correlation coefficient (R) of -0.266 and weighted average of 2.0%, a difference of 9.7%.
No Schooling Completed Correlation Summary
| Measurement | Syrian | Ugandan |
| Minimum | 0.39% | 0.56% |
| Maximum | 3.9% | 4.6% |
| Range | 3.5% | 4.1% |
| Mean | 1.5% | 1.7% |
| Median | 1.5% | 1.8% |
| Interquartile 25% (IQ1) | 0.93% | 0.85% |
| Interquartile 75% (IQ3) | 1.9% | 2.1% |
| Interquartile Range (IQR) | 0.97% | 1.2% |
| Standard Deviation (Sample) | 0.85% | 0.84% |
| Standard Deviation (Population) | 0.84% | 0.83% |
Similar Demographics by No Schooling Completed
Demographics Similar to Syrians by No Schooling Completed
In terms of no schooling completed, the demographic groups most similar to Syrians are Lebanese (1.9%, a difference of 0.020%), Immigrants from Norway (1.9%, a difference of 0.13%), Immigrants from Zimbabwe (1.9%, a difference of 0.14%), Immigrants from Serbia (1.9%, a difference of 0.22%), and Pueblo (1.9%, a difference of 0.38%).
| Demographics | Rating | Rank | No Schooling Completed |
| Okinawans | 97.1 /100 | #108 | Exceptional 1.8% |
| Immigrants | Saudi Arabia | 96.8 /100 | #109 | Exceptional 1.9% |
| Immigrants | Latvia | 96.7 /100 | #110 | Exceptional 1.9% |
| Immigrants | Japan | 96.6 /100 | #111 | Exceptional 1.9% |
| Pueblo | 96.4 /100 | #112 | Exceptional 1.9% |
| Immigrants | Zimbabwe | 96.2 /100 | #113 | Exceptional 1.9% |
| Immigrants | Norway | 96.1 /100 | #114 | Exceptional 1.9% |
| Syrians | 96.0 /100 | #115 | Exceptional 1.9% |
| Lebanese | 96.0 /100 | #116 | Exceptional 1.9% |
| Immigrants | Serbia | 95.8 /100 | #117 | Exceptional 1.9% |
| Spanish | 95.5 /100 | #118 | Exceptional 1.9% |
| Iroquois | 95.1 /100 | #119 | Exceptional 1.9% |
| Immigrants | Bulgaria | 94.6 /100 | #120 | Exceptional 1.9% |
| Immigrants | Croatia | 94.5 /100 | #121 | Exceptional 1.9% |
| Cree | 94.5 /100 | #122 | Exceptional 1.9% |
Demographics Similar to Ugandans by No Schooling Completed
In terms of no schooling completed, the demographic groups most similar to Ugandans are Immigrants from Brazil (2.1%, a difference of 0.11%), Kenyan (2.0%, a difference of 0.17%), Immigrants from Spain (2.0%, a difference of 0.29%), Immigrants from Korea (2.0%, a difference of 0.33%), and Albanian (2.1%, a difference of 0.35%).
| Demographics | Rating | Rank | No Schooling Completed |
| Immigrants | Venezuela | 68.5 /100 | #154 | Good 2.0% |
| Immigrants | Russia | 67.6 /100 | #155 | Good 2.0% |
| Chileans | 67.2 /100 | #156 | Good 2.0% |
| Immigrants | Sri Lanka | 67.0 /100 | #157 | Good 2.0% |
| Immigrants | Korea | 66.7 /100 | #158 | Good 2.0% |
| Immigrants | Spain | 66.4 /100 | #159 | Good 2.0% |
| Kenyans | 65.7 /100 | #160 | Good 2.0% |
| Ugandans | 64.6 /100 | #161 | Good 2.0% |
| Immigrants | Brazil | 63.8 /100 | #162 | Good 2.1% |
| Albanians | 62.2 /100 | #163 | Good 2.1% |
| Comanche | 60.7 /100 | #164 | Good 2.1% |
| Brazilians | 60.2 /100 | #165 | Good 2.1% |
| Dutch West Indians | 59.9 /100 | #166 | Average 2.1% |
| Egyptians | 59.2 /100 | #167 | Average 2.1% |
| Cheyenne | 58.6 /100 | #168 | Average 2.1% |