Hungarian vs Ugandan Disability
COMPARE
Hungarian
Ugandan
Disability
Disability Comparison
Hungarians
Ugandans
12.2%
DISABILITY
1.7/ 100
METRIC RATING
240th/ 347
METRIC RANK
11.4%
DISABILITY
87.9/ 100
METRIC RATING
135th/ 347
METRIC RANK
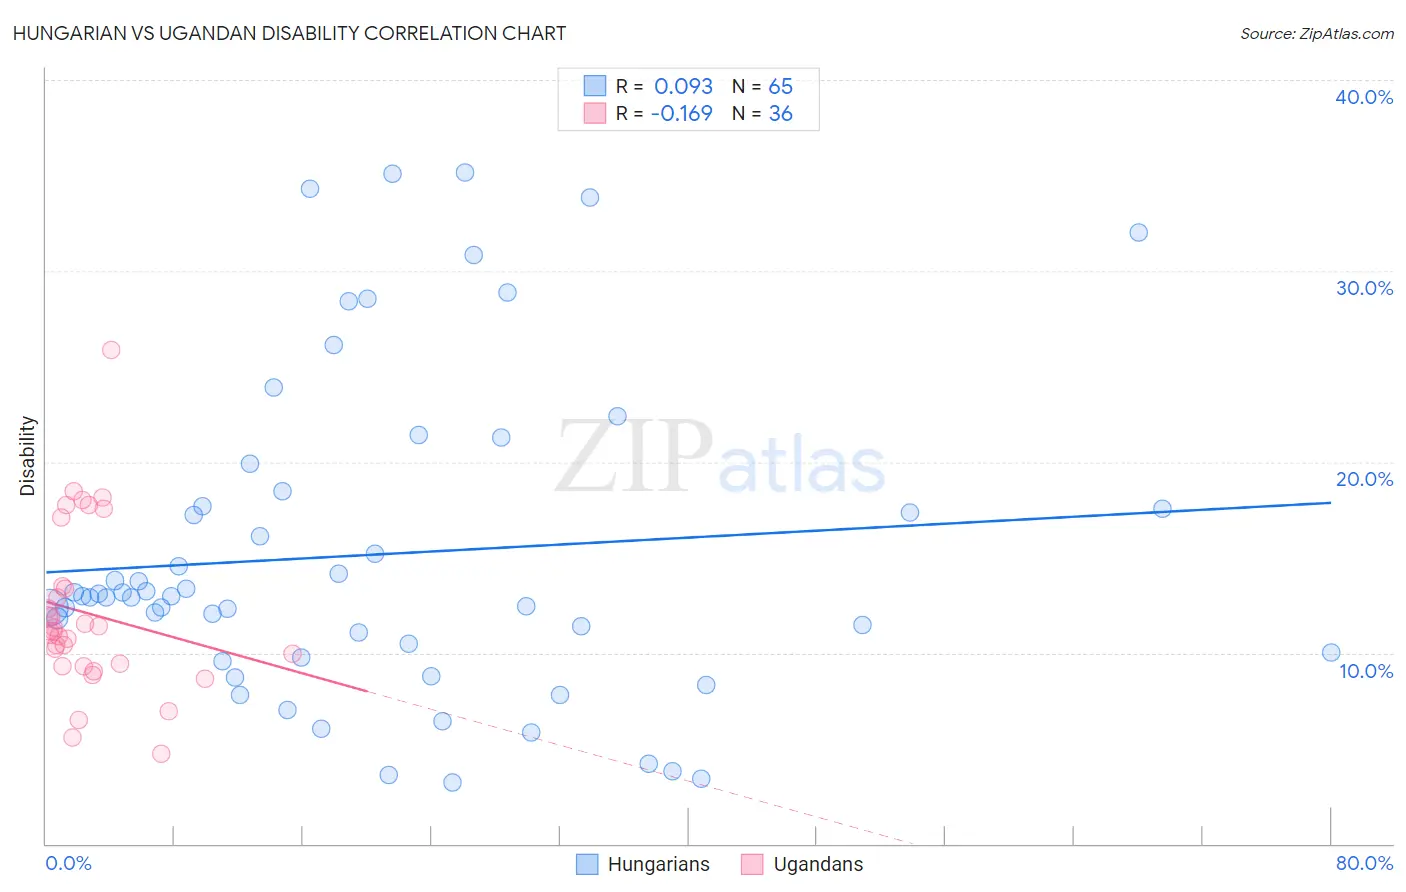
Hungarian vs Ugandan Disability Correlation Chart
The statistical analysis conducted on geographies consisting of 486,180,390 people shows a slight positive correlation between the proportion of Hungarians and percentage of population with a disability in the United States with a correlation coefficient (R) of 0.093 and weighted average of 12.2%. Similarly, the statistical analysis conducted on geographies consisting of 94,018,396 people shows a poor negative correlation between the proportion of Ugandans and percentage of population with a disability in the United States with a correlation coefficient (R) of -0.169 and weighted average of 11.4%, a difference of 6.8%.
Disability Correlation Summary
| Measurement | Hungarian | Ugandan |
| Minimum | 3.2% | 4.7% |
| Maximum | 35.2% | 25.9% |
| Range | 31.9% | 21.2% |
| Mean | 15.1% | 12.1% |
| Median | 12.9% | 11.1% |
| Interquartile 25% (IQ1) | 9.9% | 9.4% |
| Interquartile 75% (IQ3) | 18.1% | 13.4% |
| Interquartile Range (IQR) | 8.2% | 4.1% |
| Standard Deviation (Sample) | 8.3% | 4.3% |
| Standard Deviation (Population) | 8.3% | 4.3% |
Similar Demographics by Disability
Demographics Similar to Hungarians by Disability
In terms of disability, the demographic groups most similar to Hungarians are Yugoslavian (12.2%, a difference of 0.0%), Polish (12.2%, a difference of 0.020%), Swedish (12.2%, a difference of 0.050%), Norwegian (12.2%, a difference of 0.090%), and British (12.2%, a difference of 0.11%).
| Demographics | Rating | Rank | Disability |
| Bahamians | 2.3 /100 | #233 | Tragic 12.2% |
| Japanese | 2.3 /100 | #234 | Tragic 12.2% |
| Yup'ik | 2.2 /100 | #235 | Tragic 12.2% |
| Chinese | 2.0 /100 | #236 | Tragic 12.2% |
| Immigrants | Congo | 1.9 /100 | #237 | Tragic 12.2% |
| Norwegians | 1.9 /100 | #238 | Tragic 12.2% |
| Swedes | 1.8 /100 | #239 | Tragic 12.2% |
| Hungarians | 1.7 /100 | #240 | Tragic 12.2% |
| Yugoslavians | 1.7 /100 | #241 | Tragic 12.2% |
| Poles | 1.7 /100 | #242 | Tragic 12.2% |
| British | 1.5 /100 | #243 | Tragic 12.2% |
| Basques | 1.5 /100 | #244 | Tragic 12.2% |
| Liberians | 1.5 /100 | #245 | Tragic 12.2% |
| Swiss | 1.5 /100 | #246 | Tragic 12.2% |
| Indonesians | 1.4 /100 | #247 | Tragic 12.2% |
Demographics Similar to Ugandans by Disability
In terms of disability, the demographic groups most similar to Ugandans are Immigrants from St. Vincent and the Grenadines (11.4%, a difference of 0.010%), Immigrants from Guyana (11.4%, a difference of 0.050%), Kenyan (11.5%, a difference of 0.080%), New Zealander (11.5%, a difference of 0.090%), and Ghanaian (11.5%, a difference of 0.10%).
| Demographics | Rating | Rank | Disability |
| Immigrants | Europe | 90.4 /100 | #128 | Exceptional 11.4% |
| Macedonians | 90.3 /100 | #129 | Exceptional 11.4% |
| Latvians | 89.8 /100 | #130 | Excellent 11.4% |
| Immigrants | Croatia | 89.8 /100 | #131 | Excellent 11.4% |
| Immigrants | Africa | 89.3 /100 | #132 | Excellent 11.4% |
| Arabs | 89.1 /100 | #133 | Excellent 11.4% |
| Immigrants | Guyana | 88.3 /100 | #134 | Excellent 11.4% |
| Ugandans | 87.9 /100 | #135 | Excellent 11.4% |
| Immigrants | St. Vincent and the Grenadines | 87.8 /100 | #136 | Excellent 11.4% |
| Kenyans | 87.1 /100 | #137 | Excellent 11.5% |
| New Zealanders | 87.0 /100 | #138 | Excellent 11.5% |
| Ghanaians | 87.0 /100 | #139 | Excellent 11.5% |
| Russians | 86.8 /100 | #140 | Excellent 11.5% |
| Immigrants | Grenada | 86.1 /100 | #141 | Excellent 11.5% |
| Immigrants | Sudan | 85.3 /100 | #142 | Excellent 11.5% |