Hungarian vs Immigrants from Uruguay No Schooling Completed
COMPARE
Hungarian
Immigrants from Uruguay
No Schooling Completed
No Schooling Completed Comparison
Hungarians
Immigrants from Uruguay
1.6%
NO SCHOOLING COMPLETED
99.9/ 100
METRIC RATING
41st/ 347
METRIC RANK
2.3%
NO SCHOOLING COMPLETED
3.4/ 100
METRIC RATING
231st/ 347
METRIC RANK
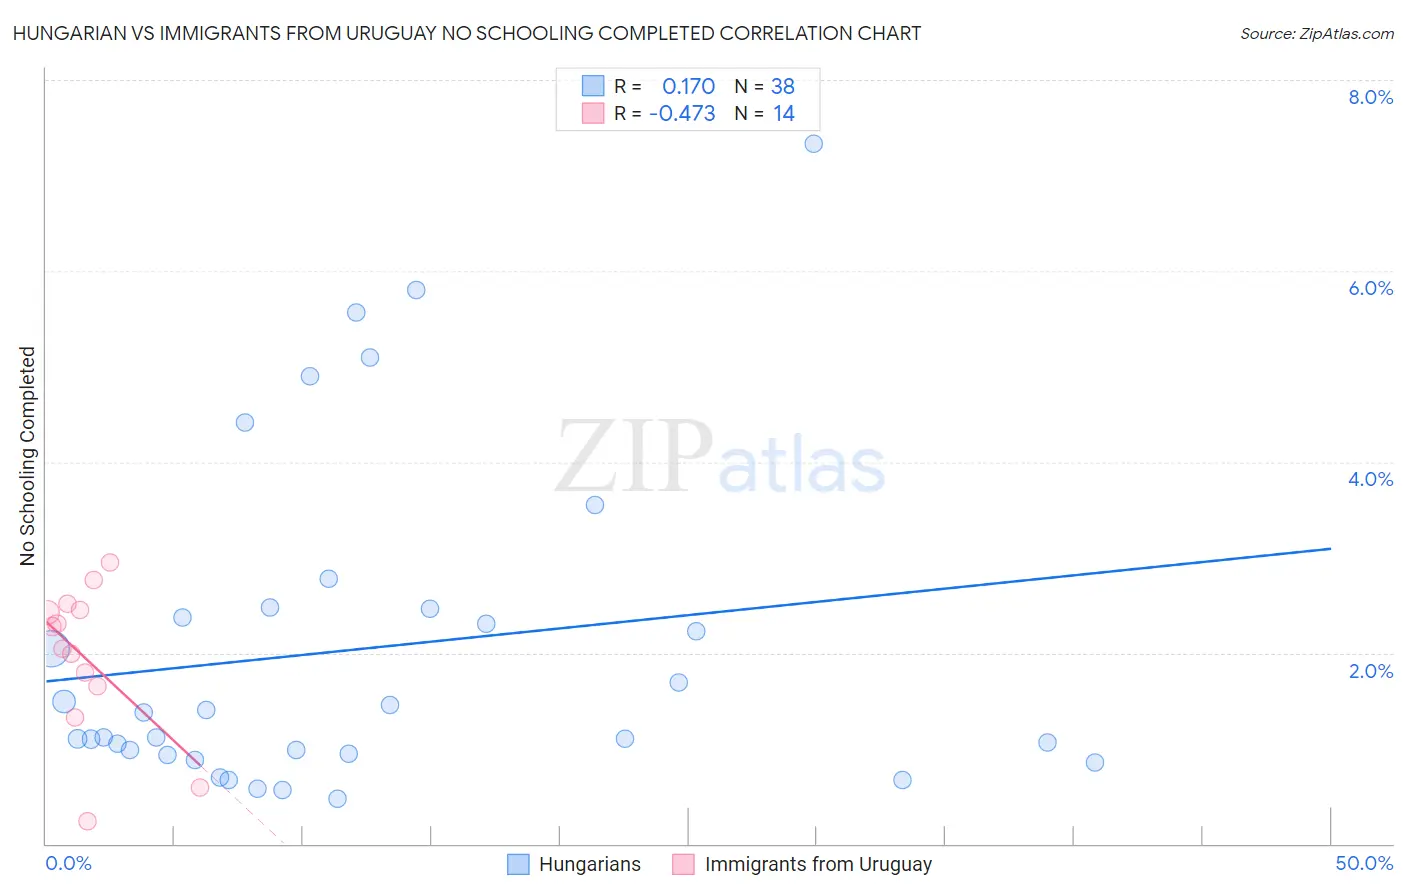
Hungarian vs Immigrants from Uruguay No Schooling Completed Correlation Chart
The statistical analysis conducted on geographies consisting of 476,473,790 people shows a poor positive correlation between the proportion of Hungarians and percentage of population with no schooling in the United States with a correlation coefficient (R) of 0.170 and weighted average of 1.6%. Similarly, the statistical analysis conducted on geographies consisting of 132,928,129 people shows a moderate negative correlation between the proportion of Immigrants from Uruguay and percentage of population with no schooling in the United States with a correlation coefficient (R) of -0.473 and weighted average of 2.3%, a difference of 46.0%.
No Schooling Completed Correlation Summary
| Measurement | Hungarian | Immigrants from Uruguay |
| Minimum | 0.47% | 0.24% |
| Maximum | 7.3% | 2.9% |
| Range | 6.9% | 2.7% |
| Mean | 2.0% | 2.0% |
| Median | 1.2% | 2.2% |
| Interquartile 25% (IQ1) | 0.94% | 1.7% |
| Interquartile 75% (IQ3) | 2.5% | 2.5% |
| Interquartile Range (IQR) | 1.5% | 0.80% |
| Standard Deviation (Sample) | 1.7% | 0.78% |
| Standard Deviation (Population) | 1.7% | 0.75% |
Similar Demographics by No Schooling Completed
Demographics Similar to Hungarians by No Schooling Completed
In terms of no schooling completed, the demographic groups most similar to Hungarians are Luxembourger (1.6%, a difference of 0.27%), Native Hawaiian (1.6%, a difference of 0.62%), Northern European (1.6%, a difference of 0.89%), Belgian (1.6%, a difference of 1.0%), and Aleut (1.6%, a difference of 1.3%).
| Demographics | Rating | Rank | No Schooling Completed |
| Latvians | 100.0 /100 | #34 | Exceptional 1.5% |
| Eastern Europeans | 100.0 /100 | #35 | Exceptional 1.6% |
| Aleuts | 99.9 /100 | #36 | Exceptional 1.6% |
| Belgians | 99.9 /100 | #37 | Exceptional 1.6% |
| Northern Europeans | 99.9 /100 | #38 | Exceptional 1.6% |
| Native Hawaiians | 99.9 /100 | #39 | Exceptional 1.6% |
| Luxembourgers | 99.9 /100 | #40 | Exceptional 1.6% |
| Hungarians | 99.9 /100 | #41 | Exceptional 1.6% |
| Bulgarians | 99.9 /100 | #42 | Exceptional 1.6% |
| Australians | 99.9 /100 | #43 | Exceptional 1.6% |
| Estonians | 99.9 /100 | #44 | Exceptional 1.6% |
| Czechoslovakians | 99.9 /100 | #45 | Exceptional 1.6% |
| Maltese | 99.9 /100 | #46 | Exceptional 1.6% |
| Ottawa | 99.9 /100 | #47 | Exceptional 1.6% |
| Immigrants | Scotland | 99.9 /100 | #48 | Exceptional 1.6% |
Demographics Similar to Immigrants from Uruguay by No Schooling Completed
In terms of no schooling completed, the demographic groups most similar to Immigrants from Uruguay are Puerto Rican (2.3%, a difference of 0.020%), Immigrants from Pakistan (2.3%, a difference of 0.16%), Colombian (2.3%, a difference of 0.22%), U.S. Virgin Islander (2.3%, a difference of 0.24%), and Immigrants from Uganda (2.3%, a difference of 0.53%).
| Demographics | Rating | Rank | No Schooling Completed |
| Tohono O'odham | 4.1 /100 | #224 | Tragic 2.3% |
| Sudanese | 4.1 /100 | #225 | Tragic 2.3% |
| Sierra Leoneans | 4.1 /100 | #226 | Tragic 2.3% |
| Immigrants | Uganda | 4.0 /100 | #227 | Tragic 2.3% |
| U.S. Virgin Islanders | 3.7 /100 | #228 | Tragic 2.3% |
| Immigrants | Pakistan | 3.6 /100 | #229 | Tragic 2.3% |
| Puerto Ricans | 3.4 /100 | #230 | Tragic 2.3% |
| Immigrants | Uruguay | 3.4 /100 | #231 | Tragic 2.3% |
| Colombians | 3.2 /100 | #232 | Tragic 2.3% |
| Immigrants | Malaysia | 2.8 /100 | #233 | Tragic 2.3% |
| Nigerians | 2.6 /100 | #234 | Tragic 2.3% |
| Immigrants | Western Asia | 2.6 /100 | #235 | Tragic 2.3% |
| Iraqis | 2.2 /100 | #236 | Tragic 2.4% |
| Immigrants | Eastern Asia | 2.0 /100 | #237 | Tragic 2.4% |
| Paiute | 1.9 /100 | #238 | Tragic 2.4% |