Ute vs Ugandan No Schooling Completed
COMPARE
Ute
Ugandan
No Schooling Completed
No Schooling Completed Comparison
Ute
Ugandans
2.3%
NO SCHOOLING COMPLETED
8.2/ 100
METRIC RATING
213th/ 347
METRIC RANK
2.0%
NO SCHOOLING COMPLETED
64.6/ 100
METRIC RATING
161st/ 347
METRIC RANK
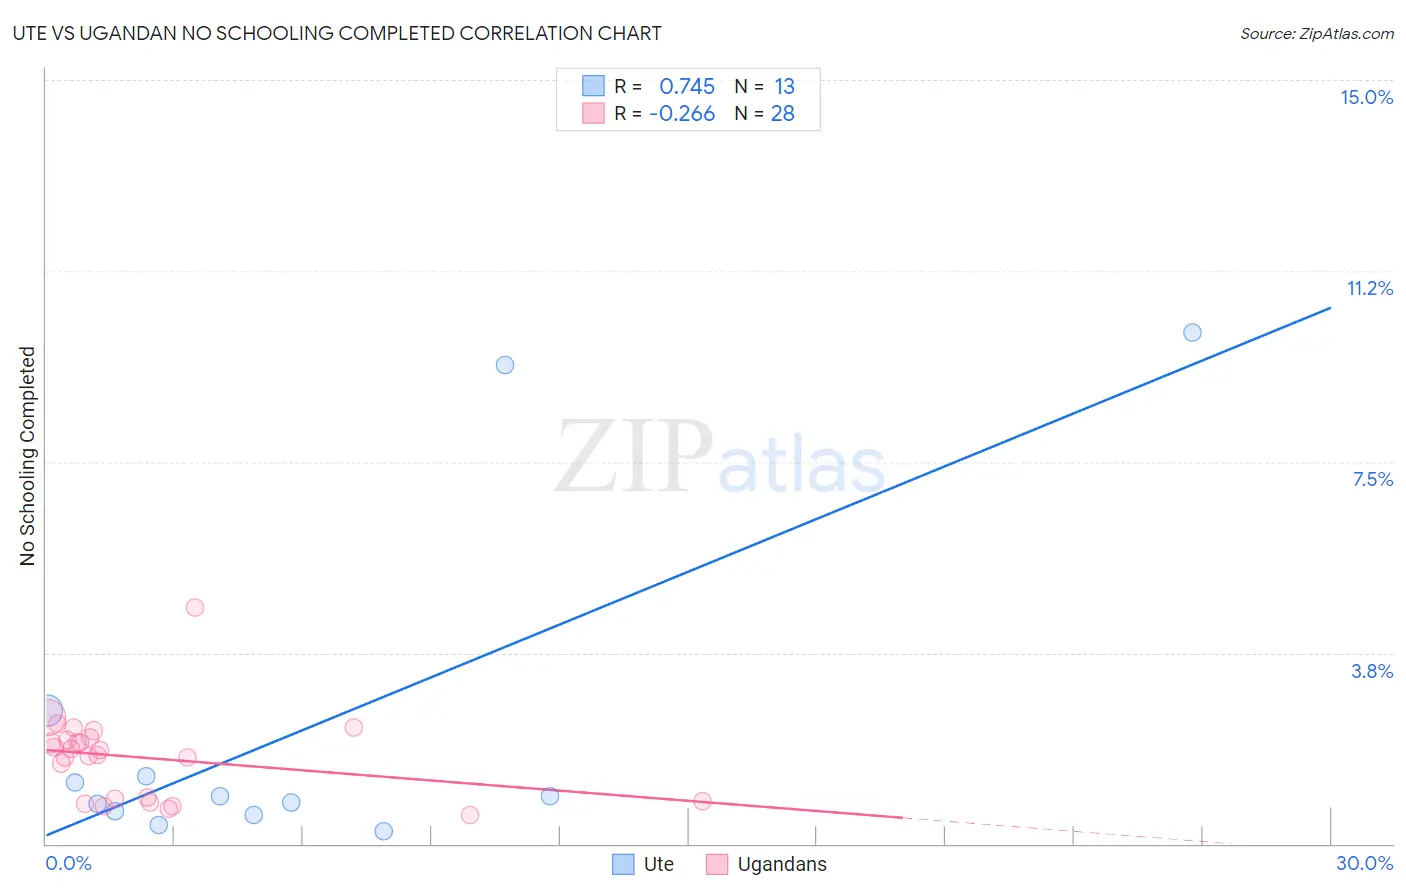
Ute vs Ugandan No Schooling Completed Correlation Chart
The statistical analysis conducted on geographies consisting of 55,448,088 people shows a strong positive correlation between the proportion of Ute and percentage of population with no schooling in the United States with a correlation coefficient (R) of 0.745 and weighted average of 2.3%. Similarly, the statistical analysis conducted on geographies consisting of 93,762,117 people shows a weak negative correlation between the proportion of Ugandans and percentage of population with no schooling in the United States with a correlation coefficient (R) of -0.266 and weighted average of 2.0%, a difference of 10.3%.
No Schooling Completed Correlation Summary
| Measurement | Ute | Ugandan |
| Minimum | 0.24% | 0.56% |
| Maximum | 10.1% | 4.6% |
| Range | 9.8% | 4.1% |
| Mean | 2.3% | 1.7% |
| Median | 0.92% | 1.8% |
| Interquartile 25% (IQ1) | 0.61% | 0.85% |
| Interquartile 75% (IQ3) | 2.0% | 2.1% |
| Interquartile Range (IQR) | 1.4% | 1.2% |
| Standard Deviation (Sample) | 3.4% | 0.84% |
| Standard Deviation (Population) | 3.2% | 0.83% |
Similar Demographics by No Schooling Completed
Demographics Similar to Ute by No Schooling Completed
In terms of no schooling completed, the demographic groups most similar to Ute are Samoan (2.3%, a difference of 0.040%), Immigrants from Morocco (2.3%, a difference of 0.19%), Immigrants from Panama (2.3%, a difference of 0.20%), Immigrants from Zaire (2.3%, a difference of 0.47%), and Native/Alaskan (2.2%, a difference of 0.66%).
| Demographics | Rating | Rank | No Schooling Completed |
| Bahamians | 11.6 /100 | #206 | Poor 2.2% |
| South American Indians | 11.0 /100 | #207 | Poor 2.2% |
| Uruguayans | 11.0 /100 | #208 | Poor 2.2% |
| Immigrants | Oceania | 10.2 /100 | #209 | Poor 2.2% |
| Natives/Alaskans | 10.0 /100 | #210 | Tragic 2.2% |
| Immigrants | Panama | 8.8 /100 | #211 | Tragic 2.3% |
| Immigrants | Morocco | 8.7 /100 | #212 | Tragic 2.3% |
| Ute | 8.2 /100 | #213 | Tragic 2.3% |
| Samoans | 8.2 /100 | #214 | Tragic 2.3% |
| Immigrants | Zaire | 7.2 /100 | #215 | Tragic 2.3% |
| Tongans | 6.8 /100 | #216 | Tragic 2.3% |
| Immigrants | Syria | 6.6 /100 | #217 | Tragic 2.3% |
| Immigrants | Nepal | 6.4 /100 | #218 | Tragic 2.3% |
| Senegalese | 5.6 /100 | #219 | Tragic 2.3% |
| Immigrants | Costa Rica | 5.1 /100 | #220 | Tragic 2.3% |
Demographics Similar to Ugandans by No Schooling Completed
In terms of no schooling completed, the demographic groups most similar to Ugandans are Immigrants from Brazil (2.1%, a difference of 0.11%), Kenyan (2.0%, a difference of 0.17%), Immigrants from Spain (2.0%, a difference of 0.29%), Immigrants from Korea (2.0%, a difference of 0.33%), and Albanian (2.1%, a difference of 0.35%).
| Demographics | Rating | Rank | No Schooling Completed |
| Immigrants | Venezuela | 68.5 /100 | #154 | Good 2.0% |
| Immigrants | Russia | 67.6 /100 | #155 | Good 2.0% |
| Chileans | 67.2 /100 | #156 | Good 2.0% |
| Immigrants | Sri Lanka | 67.0 /100 | #157 | Good 2.0% |
| Immigrants | Korea | 66.7 /100 | #158 | Good 2.0% |
| Immigrants | Spain | 66.4 /100 | #159 | Good 2.0% |
| Kenyans | 65.7 /100 | #160 | Good 2.0% |
| Ugandans | 64.6 /100 | #161 | Good 2.0% |
| Immigrants | Brazil | 63.8 /100 | #162 | Good 2.1% |
| Albanians | 62.2 /100 | #163 | Good 2.1% |
| Comanche | 60.7 /100 | #164 | Good 2.1% |
| Brazilians | 60.2 /100 | #165 | Good 2.1% |
| Dutch West Indians | 59.9 /100 | #166 | Average 2.1% |
| Egyptians | 59.2 /100 | #167 | Average 2.1% |
| Cheyenne | 58.6 /100 | #168 | Average 2.1% |