Latvian vs Osage GED/Equivalency
COMPARE
Latvian
Osage
GED/Equivalency
GED/Equivalency Comparison
Latvians
Osage
89.2%
GED/EQUIVALENCY
100.0/ 100
METRIC RATING
5th/ 347
METRIC RANK
84.8%
GED/EQUIVALENCY
9.5/ 100
METRIC RATING
214th/ 347
METRIC RANK
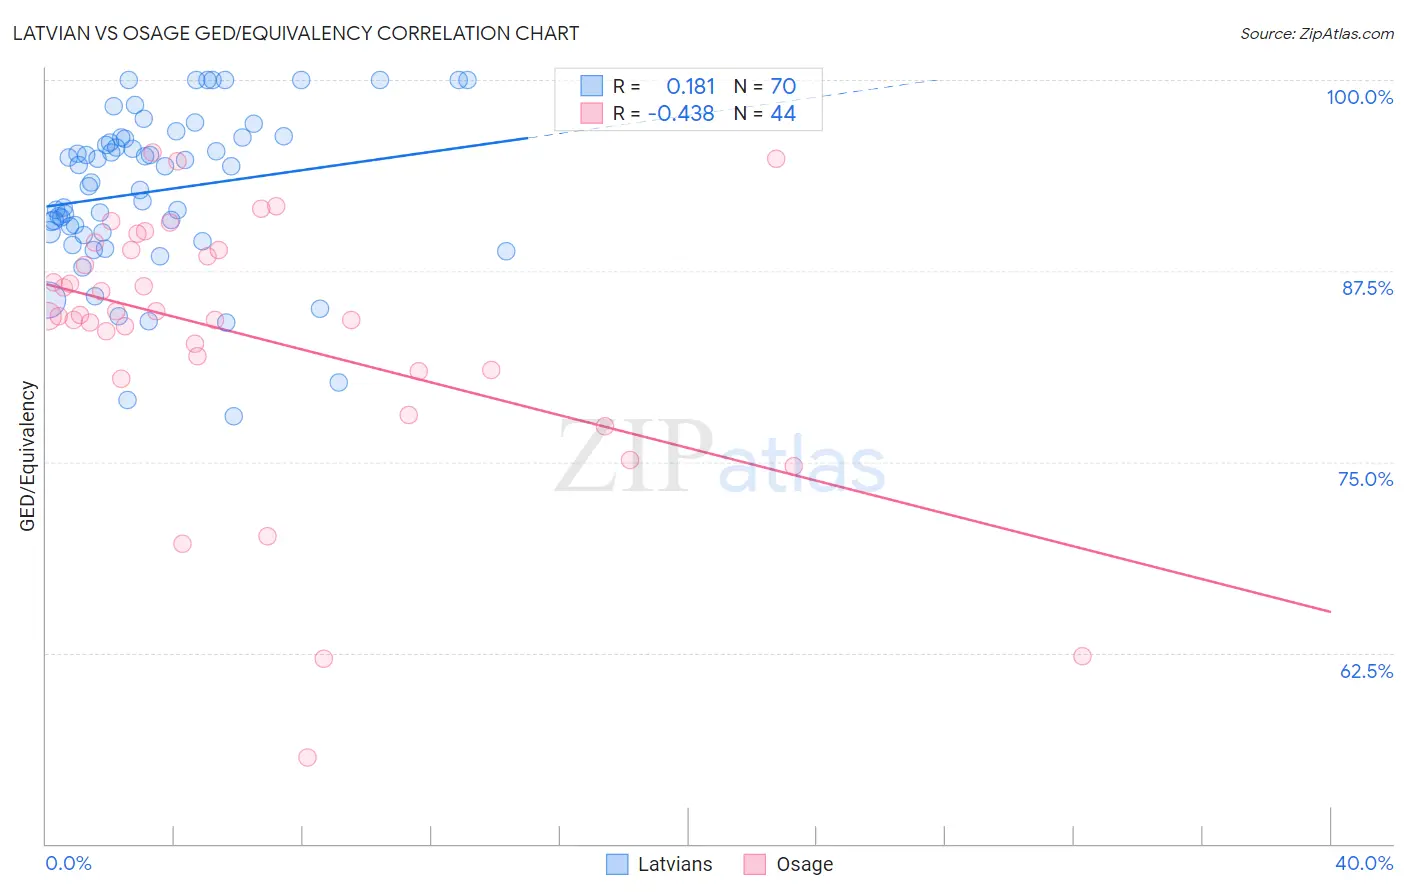
Latvian vs Osage GED/Equivalency Correlation Chart
The statistical analysis conducted on geographies consisting of 220,726,693 people shows a poor positive correlation between the proportion of Latvians and percentage of population with at least ged/equivalency education in the United States with a correlation coefficient (R) of 0.181 and weighted average of 89.2%. Similarly, the statistical analysis conducted on geographies consisting of 91,808,913 people shows a moderate negative correlation between the proportion of Osage and percentage of population with at least ged/equivalency education in the United States with a correlation coefficient (R) of -0.438 and weighted average of 84.8%, a difference of 5.2%.
GED/Equivalency Correlation Summary
| Measurement | Latvian | Osage |
| Minimum | 78.0% | 55.6% |
| Maximum | 100.0% | 95.3% |
| Range | 22.0% | 39.6% |
| Mean | 92.8% | 83.3% |
| Median | 93.8% | 84.6% |
| Interquartile 25% (IQ1) | 90.0% | 81.0% |
| Interquartile 75% (IQ3) | 96.2% | 88.9% |
| Interquartile Range (IQR) | 6.2% | 7.9% |
| Standard Deviation (Sample) | 5.2% | 8.6% |
| Standard Deviation (Population) | 5.2% | 8.5% |
Similar Demographics by GED/Equivalency
Demographics Similar to Latvians by GED/Equivalency
In terms of ged/equivalency, the demographic groups most similar to Latvians are Thai (89.1%, a difference of 0.020%), Eastern European (89.1%, a difference of 0.060%), Iranian (89.2%, a difference of 0.10%), Carpatho Rusyn (89.1%, a difference of 0.11%), and Chinese (89.0%, a difference of 0.13%).
| Demographics | Rating | Rank | GED/Equivalency |
| Immigrants | India | 100.0 /100 | #1 | Exceptional 89.7% |
| Filipinos | 100.0 /100 | #2 | Exceptional 89.5% |
| Immigrants | Singapore | 100.0 /100 | #3 | Exceptional 89.3% |
| Iranians | 100.0 /100 | #4 | Exceptional 89.2% |
| Latvians | 100.0 /100 | #5 | Exceptional 89.2% |
| Thais | 100.0 /100 | #6 | Exceptional 89.1% |
| Eastern Europeans | 99.9 /100 | #7 | Exceptional 89.1% |
| Carpatho Rusyns | 99.9 /100 | #8 | Exceptional 89.1% |
| Chinese | 99.9 /100 | #9 | Exceptional 89.0% |
| Norwegians | 99.9 /100 | #10 | Exceptional 89.0% |
| Bulgarians | 99.9 /100 | #11 | Exceptional 89.0% |
| Lithuanians | 99.9 /100 | #12 | Exceptional 88.9% |
| Immigrants | Iran | 99.9 /100 | #13 | Exceptional 88.9% |
| Cypriots | 99.9 /100 | #14 | Exceptional 88.9% |
| Okinawans | 99.9 /100 | #15 | Exceptional 88.9% |
Demographics Similar to Osage by GED/Equivalency
In terms of ged/equivalency, the demographic groups most similar to Osage are Peruvian (84.7%, a difference of 0.020%), Immigrants from Philippines (84.8%, a difference of 0.030%), Immigrants from Micronesia (84.7%, a difference of 0.050%), Nigerian (84.7%, a difference of 0.050%), and Immigrants from Somalia (84.8%, a difference of 0.060%).
| Demographics | Rating | Rank | GED/Equivalency |
| Hmong | 13.1 /100 | #207 | Poor 84.9% |
| Marshallese | 12.5 /100 | #208 | Poor 84.9% |
| Colombians | 12.3 /100 | #209 | Poor 84.9% |
| Immigrants | Cameroon | 12.1 /100 | #210 | Poor 84.9% |
| South Americans | 10.9 /100 | #211 | Poor 84.8% |
| Immigrants | Somalia | 10.6 /100 | #212 | Poor 84.8% |
| Immigrants | Philippines | 10.0 /100 | #213 | Poor 84.8% |
| Osage | 9.5 /100 | #214 | Tragic 84.8% |
| Peruvians | 9.2 /100 | #215 | Tragic 84.7% |
| Immigrants | Micronesia | 8.7 /100 | #216 | Tragic 84.7% |
| Nigerians | 8.6 /100 | #217 | Tragic 84.7% |
| Alaska Natives | 8.6 /100 | #218 | Tragic 84.7% |
| Potawatomi | 8.2 /100 | #219 | Tragic 84.7% |
| Americans | 8.2 /100 | #220 | Tragic 84.7% |
| Taiwanese | 8.1 /100 | #221 | Tragic 84.7% |