Greek vs Mexican American Indian GED/Equivalency
COMPARE
Greek
Mexican American Indian
GED/Equivalency
GED/Equivalency Comparison
Greeks
Mexican American Indians
88.1%
GED/EQUIVALENCY
99.5/ 100
METRIC RATING
48th/ 347
METRIC RANK
79.4%
GED/EQUIVALENCY
0.0/ 100
METRIC RATING
324th/ 347
METRIC RANK
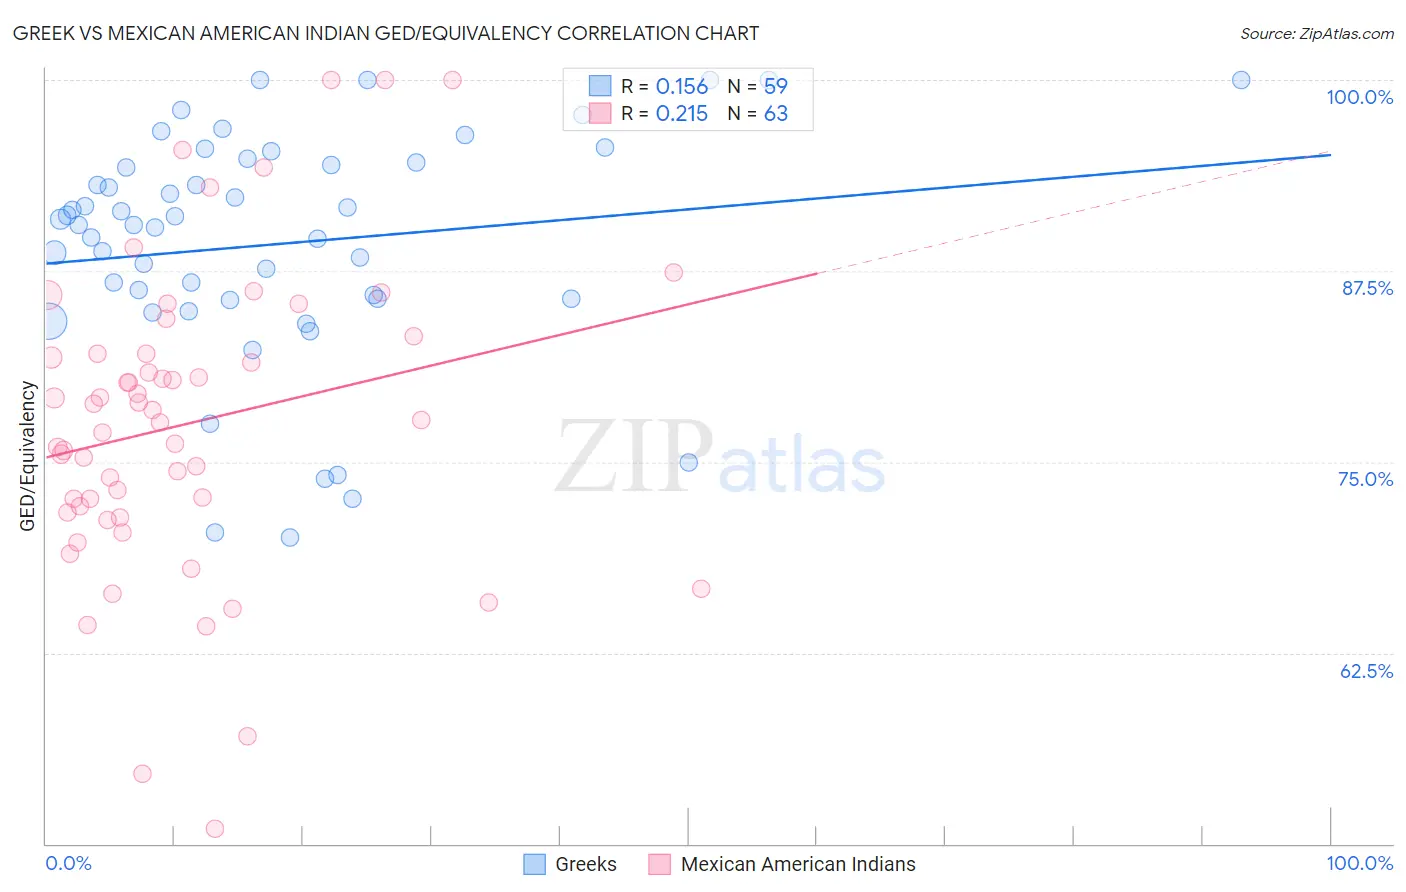
Greek vs Mexican American Indian GED/Equivalency Correlation Chart
The statistical analysis conducted on geographies consisting of 482,775,362 people shows a poor positive correlation between the proportion of Greeks and percentage of population with at least ged/equivalency education in the United States with a correlation coefficient (R) of 0.156 and weighted average of 88.1%. Similarly, the statistical analysis conducted on geographies consisting of 317,621,155 people shows a weak positive correlation between the proportion of Mexican American Indians and percentage of population with at least ged/equivalency education in the United States with a correlation coefficient (R) of 0.215 and weighted average of 79.4%, a difference of 11.0%.
GED/Equivalency Correlation Summary
| Measurement | Greek | Mexican American Indian |
| Minimum | 70.0% | 51.0% |
| Maximum | 100.0% | 100.0% |
| Range | 30.0% | 49.0% |
| Mean | 89.2% | 77.5% |
| Median | 90.5% | 77.8% |
| Interquartile 25% (IQ1) | 85.7% | 71.7% |
| Interquartile 75% (IQ3) | 94.6% | 82.1% |
| Interquartile Range (IQR) | 8.9% | 10.4% |
| Standard Deviation (Sample) | 7.5% | 10.0% |
| Standard Deviation (Population) | 7.4% | 9.9% |
Similar Demographics by GED/Equivalency
Demographics Similar to Greeks by GED/Equivalency
In terms of ged/equivalency, the demographic groups most similar to Greeks are Immigrants from Latvia (88.1%, a difference of 0.010%), Australian (88.1%, a difference of 0.010%), Immigrants from Switzerland (88.1%, a difference of 0.020%), Immigrants from Korea (88.1%, a difference of 0.020%), and Czech (88.1%, a difference of 0.030%).
| Demographics | Rating | Rank | GED/Equivalency |
| Finns | 99.6 /100 | #41 | Exceptional 88.2% |
| Cambodians | 99.6 /100 | #42 | Exceptional 88.2% |
| Immigrants | Scotland | 99.6 /100 | #43 | Exceptional 88.2% |
| Macedonians | 99.5 /100 | #44 | Exceptional 88.1% |
| Czechs | 99.5 /100 | #45 | Exceptional 88.1% |
| Immigrants | Switzerland | 99.5 /100 | #46 | Exceptional 88.1% |
| Immigrants | Latvia | 99.5 /100 | #47 | Exceptional 88.1% |
| Greeks | 99.5 /100 | #48 | Exceptional 88.1% |
| Australians | 99.5 /100 | #49 | Exceptional 88.1% |
| Immigrants | Korea | 99.5 /100 | #50 | Exceptional 88.1% |
| Immigrants | Netherlands | 99.4 /100 | #51 | Exceptional 88.0% |
| Zimbabweans | 99.4 /100 | #52 | Exceptional 88.0% |
| Immigrants | South Africa | 99.4 /100 | #53 | Exceptional 88.0% |
| Soviet Union | 99.4 /100 | #54 | Exceptional 88.0% |
| New Zealanders | 99.4 /100 | #55 | Exceptional 88.0% |
Demographics Similar to Mexican American Indians by GED/Equivalency
In terms of ged/equivalency, the demographic groups most similar to Mexican American Indians are Honduran (79.3%, a difference of 0.12%), Yuman (79.2%, a difference of 0.21%), Central American (79.2%, a difference of 0.23%), Hispanic or Latino (79.1%, a difference of 0.34%), and Dominican (79.1%, a difference of 0.38%).
| Demographics | Rating | Rank | GED/Equivalency |
| Immigrants | Caribbean | 0.0 /100 | #317 | Tragic 80.5% |
| Yaqui | 0.0 /100 | #318 | Tragic 80.5% |
| Immigrants | Belize | 0.0 /100 | #319 | Tragic 80.5% |
| Immigrants | Cuba | 0.0 /100 | #320 | Tragic 80.2% |
| Yup'ik | 0.0 /100 | #321 | Tragic 80.0% |
| Lumbee | 0.0 /100 | #322 | Tragic 80.0% |
| Immigrants | Nicaragua | 0.0 /100 | #323 | Tragic 79.9% |
| Mexican American Indians | 0.0 /100 | #324 | Tragic 79.4% |
| Hondurans | 0.0 /100 | #325 | Tragic 79.3% |
| Yuman | 0.0 /100 | #326 | Tragic 79.2% |
| Central Americans | 0.0 /100 | #327 | Tragic 79.2% |
| Hispanics or Latinos | 0.0 /100 | #328 | Tragic 79.1% |
| Dominicans | 0.0 /100 | #329 | Tragic 79.1% |
| Immigrants | Cabo Verde | 0.0 /100 | #330 | Tragic 78.9% |
| Immigrants | Honduras | 0.0 /100 | #331 | Tragic 78.7% |