Fijian vs Immigrants from Trinidad and Tobago Doctorate Degree
COMPARE
Fijian
Immigrants from Trinidad and Tobago
Doctorate Degree
Doctorate Degree Comparison
Fijians
Immigrants from Trinidad and Tobago
1.1%
DOCTORATE DEGREE
0.0/ 100
METRIC RATING
343rd/ 347
METRIC RANK
1.5%
DOCTORATE DEGREE
0.5/ 100
METRIC RATING
271st/ 347
METRIC RANK
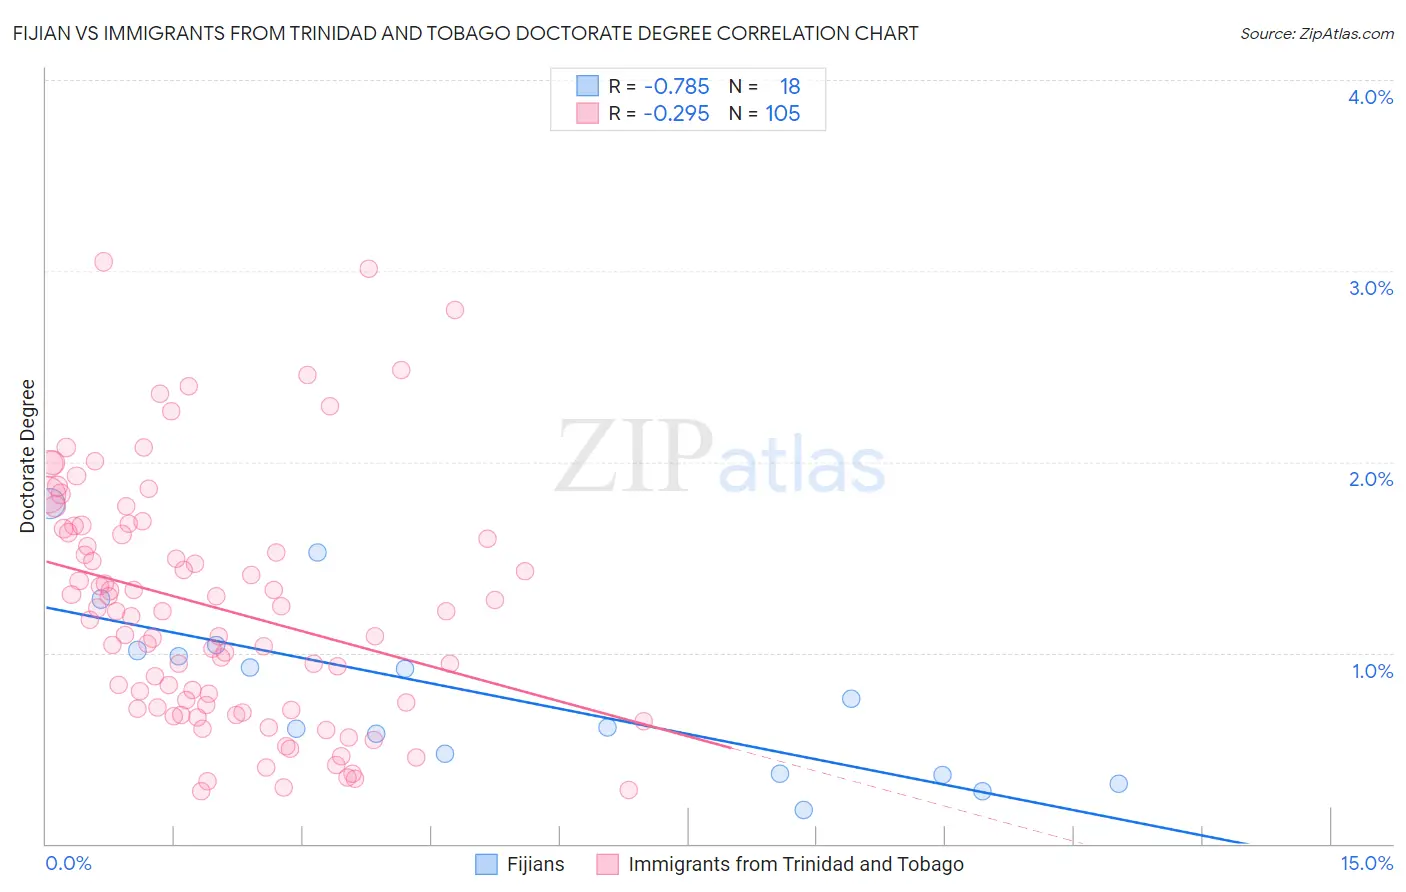
Fijian vs Immigrants from Trinidad and Tobago Doctorate Degree Correlation Chart
The statistical analysis conducted on geographies consisting of 55,685,158 people shows a strong negative correlation between the proportion of Fijians and percentage of population with at least doctorate degree education in the United States with a correlation coefficient (R) of -0.785 and weighted average of 1.1%. Similarly, the statistical analysis conducted on geographies consisting of 222,674,417 people shows a weak negative correlation between the proportion of Immigrants from Trinidad and Tobago and percentage of population with at least doctorate degree education in the United States with a correlation coefficient (R) of -0.295 and weighted average of 1.5%, a difference of 30.8%.
Doctorate Degree Correlation Summary
| Measurement | Fijian | Immigrants from Trinidad and Tobago |
| Minimum | 0.18% | 0.28% |
| Maximum | 1.8% | 3.0% |
| Range | 1.6% | 2.8% |
| Mean | 0.78% | 1.2% |
| Median | 0.68% | 1.2% |
| Interquartile 25% (IQ1) | 0.37% | 0.71% |
| Interquartile 75% (IQ3) | 1.0% | 1.6% |
| Interquartile Range (IQR) | 0.64% | 0.93% |
| Standard Deviation (Sample) | 0.45% | 0.63% |
| Standard Deviation (Population) | 0.43% | 0.63% |
Similar Demographics by Doctorate Degree
Demographics Similar to Fijians by Doctorate Degree
In terms of doctorate degree, the demographic groups most similar to Fijians are Immigrants from Mexico (1.1%, a difference of 2.1%), Arapaho (1.2%, a difference of 3.4%), Lumbee (1.1%, a difference of 3.6%), Mexican (1.2%, a difference of 3.8%), and Immigrants from Cuba (1.2%, a difference of 4.3%).
| Demographics | Rating | Rank | Doctorate Degree |
| Immigrants | Caribbean | 0.0 /100 | #333 | Tragic 1.3% |
| Immigrants | Dominican Republic | 0.0 /100 | #334 | Tragic 1.3% |
| Immigrants | Haiti | 0.0 /100 | #335 | Tragic 1.3% |
| Nepalese | 0.0 /100 | #336 | Tragic 1.3% |
| Bangladeshis | 0.0 /100 | #337 | Tragic 1.2% |
| Puget Sound Salish | 0.0 /100 | #338 | Tragic 1.2% |
| Immigrants | Central America | 0.0 /100 | #339 | Tragic 1.2% |
| Immigrants | Cuba | 0.0 /100 | #340 | Tragic 1.2% |
| Mexicans | 0.0 /100 | #341 | Tragic 1.2% |
| Arapaho | 0.0 /100 | #342 | Tragic 1.2% |
| Fijians | 0.0 /100 | #343 | Tragic 1.1% |
| Immigrants | Mexico | 0.0 /100 | #344 | Tragic 1.1% |
| Lumbee | 0.0 /100 | #345 | Tragic 1.1% |
| Spanish American Indians | 0.0 /100 | #346 | Tragic 1.1% |
| Houma | 0.0 /100 | #347 | Tragic 0.96% |
Demographics Similar to Immigrants from Trinidad and Tobago by Doctorate Degree
In terms of doctorate degree, the demographic groups most similar to Immigrants from Trinidad and Tobago are Salvadoran (1.5%, a difference of 0.070%), Immigrants from Barbados (1.5%, a difference of 0.090%), Crow (1.5%, a difference of 0.10%), Kiowa (1.5%, a difference of 0.19%), and U.S. Virgin Islander (1.5%, a difference of 0.19%).
| Demographics | Rating | Rank | Doctorate Degree |
| Blackfeet | 0.7 /100 | #264 | Tragic 1.5% |
| Nicaraguans | 0.6 /100 | #265 | Tragic 1.5% |
| Immigrants | Liberia | 0.5 /100 | #266 | Tragic 1.5% |
| Kiowa | 0.5 /100 | #267 | Tragic 1.5% |
| U.S. Virgin Islanders | 0.5 /100 | #268 | Tragic 1.5% |
| Crow | 0.5 /100 | #269 | Tragic 1.5% |
| Salvadorans | 0.5 /100 | #270 | Tragic 1.5% |
| Immigrants | Trinidad and Tobago | 0.5 /100 | #271 | Tragic 1.5% |
| Immigrants | Barbados | 0.4 /100 | #272 | Tragic 1.5% |
| Sioux | 0.4 /100 | #273 | Tragic 1.5% |
| Yaqui | 0.4 /100 | #274 | Tragic 1.5% |
| Aleuts | 0.4 /100 | #275 | Tragic 1.5% |
| Paiute | 0.4 /100 | #276 | Tragic 1.5% |
| Bahamians | 0.4 /100 | #277 | Tragic 1.5% |
| Hawaiians | 0.4 /100 | #278 | Tragic 1.5% |