Immigrants from Norway vs Immigrants from Trinidad and Tobago Doctorate Degree
COMPARE
Immigrants from Norway
Immigrants from Trinidad and Tobago
Doctorate Degree
Doctorate Degree Comparison
Immigrants from Norway
Immigrants from Trinidad and Tobago
2.4%
DOCTORATE DEGREE
100.0/ 100
METRIC RATING
50th/ 347
METRIC RANK
1.5%
DOCTORATE DEGREE
0.5/ 100
METRIC RATING
271st/ 347
METRIC RANK
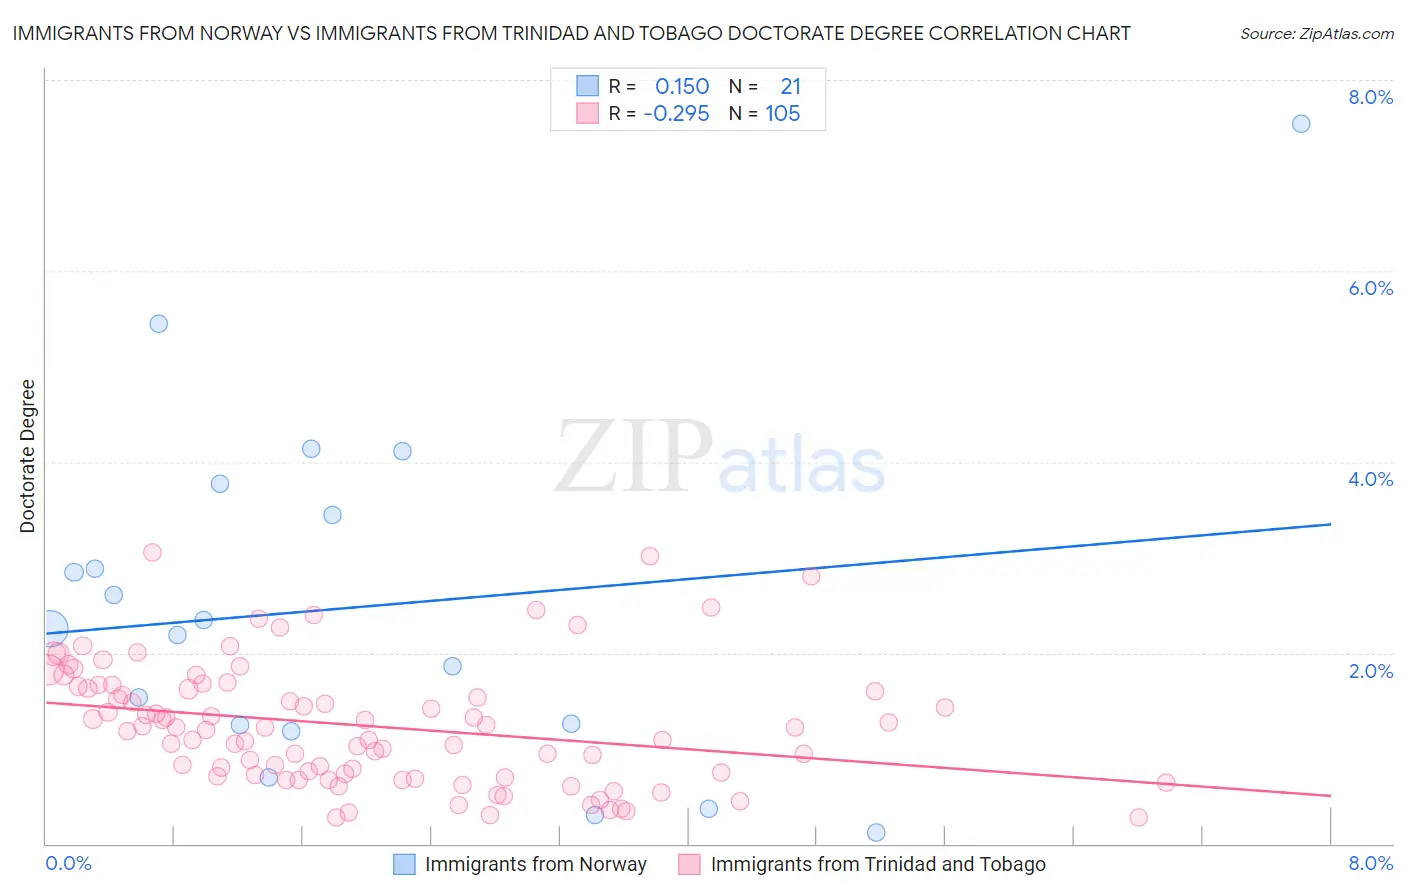
Immigrants from Norway vs Immigrants from Trinidad and Tobago Doctorate Degree Correlation Chart
The statistical analysis conducted on geographies consisting of 116,506,510 people shows a poor positive correlation between the proportion of Immigrants from Norway and percentage of population with at least doctorate degree education in the United States with a correlation coefficient (R) of 0.150 and weighted average of 2.4%. Similarly, the statistical analysis conducted on geographies consisting of 222,674,417 people shows a weak negative correlation between the proportion of Immigrants from Trinidad and Tobago and percentage of population with at least doctorate degree education in the United States with a correlation coefficient (R) of -0.295 and weighted average of 1.5%, a difference of 62.6%.
Doctorate Degree Correlation Summary
| Measurement | Immigrants from Norway | Immigrants from Trinidad and Tobago |
| Minimum | 0.12% | 0.28% |
| Maximum | 7.5% | 3.0% |
| Range | 7.4% | 2.8% |
| Mean | 2.5% | 1.2% |
| Median | 2.3% | 1.2% |
| Interquartile 25% (IQ1) | 1.2% | 0.71% |
| Interquartile 75% (IQ3) | 3.6% | 1.6% |
| Interquartile Range (IQR) | 2.4% | 0.93% |
| Standard Deviation (Sample) | 1.8% | 0.63% |
| Standard Deviation (Population) | 1.8% | 0.63% |
Similar Demographics by Doctorate Degree
Demographics Similar to Immigrants from Norway by Doctorate Degree
In terms of doctorate degree, the demographic groups most similar to Immigrants from Norway are Australian (2.4%, a difference of 0.090%), Bulgarian (2.4%, a difference of 0.56%), Immigrants from Latvia (2.4%, a difference of 0.68%), Immigrants from Asia (2.4%, a difference of 1.1%), and Asian (2.4%, a difference of 1.3%).
| Demographics | Rating | Rank | Doctorate Degree |
| Soviet Union | 100.0 /100 | #43 | Exceptional 2.5% |
| Immigrants | Netherlands | 100.0 /100 | #44 | Exceptional 2.5% |
| Immigrants | South Africa | 100.0 /100 | #45 | Exceptional 2.4% |
| Immigrants | Austria | 100.0 /100 | #46 | Exceptional 2.4% |
| Immigrants | Western Europe | 100.0 /100 | #47 | Exceptional 2.4% |
| Asians | 100.0 /100 | #48 | Exceptional 2.4% |
| Immigrants | Asia | 100.0 /100 | #49 | Exceptional 2.4% |
| Immigrants | Norway | 100.0 /100 | #50 | Exceptional 2.4% |
| Australians | 100.0 /100 | #51 | Exceptional 2.4% |
| Bulgarians | 100.0 /100 | #52 | Exceptional 2.4% |
| Immigrants | Latvia | 100.0 /100 | #53 | Exceptional 2.4% |
| Immigrants | Indonesia | 100.0 /100 | #54 | Exceptional 2.4% |
| Bolivians | 100.0 /100 | #55 | Exceptional 2.4% |
| Immigrants | Czechoslovakia | 100.0 /100 | #56 | Exceptional 2.4% |
| Immigrants | Ethiopia | 100.0 /100 | #57 | Exceptional 2.4% |
Demographics Similar to Immigrants from Trinidad and Tobago by Doctorate Degree
In terms of doctorate degree, the demographic groups most similar to Immigrants from Trinidad and Tobago are Salvadoran (1.5%, a difference of 0.070%), Immigrants from Barbados (1.5%, a difference of 0.090%), Crow (1.5%, a difference of 0.10%), Kiowa (1.5%, a difference of 0.19%), and U.S. Virgin Islander (1.5%, a difference of 0.19%).
| Demographics | Rating | Rank | Doctorate Degree |
| Blackfeet | 0.7 /100 | #264 | Tragic 1.5% |
| Nicaraguans | 0.6 /100 | #265 | Tragic 1.5% |
| Immigrants | Liberia | 0.5 /100 | #266 | Tragic 1.5% |
| Kiowa | 0.5 /100 | #267 | Tragic 1.5% |
| U.S. Virgin Islanders | 0.5 /100 | #268 | Tragic 1.5% |
| Crow | 0.5 /100 | #269 | Tragic 1.5% |
| Salvadorans | 0.5 /100 | #270 | Tragic 1.5% |
| Immigrants | Trinidad and Tobago | 0.5 /100 | #271 | Tragic 1.5% |
| Immigrants | Barbados | 0.4 /100 | #272 | Tragic 1.5% |
| Sioux | 0.4 /100 | #273 | Tragic 1.5% |
| Yaqui | 0.4 /100 | #274 | Tragic 1.5% |
| Aleuts | 0.4 /100 | #275 | Tragic 1.5% |
| Paiute | 0.4 /100 | #276 | Tragic 1.5% |
| Bahamians | 0.4 /100 | #277 | Tragic 1.5% |
| Hawaiians | 0.4 /100 | #278 | Tragic 1.5% |