Cheyenne vs Immigrants from Trinidad and Tobago Doctorate Degree
COMPARE
Cheyenne
Immigrants from Trinidad and Tobago
Doctorate Degree
Doctorate Degree Comparison
Cheyenne
Immigrants from Trinidad and Tobago
1.6%
DOCTORATE DEGREE
2.3/ 100
METRIC RATING
241st/ 347
METRIC RANK
1.5%
DOCTORATE DEGREE
0.5/ 100
METRIC RATING
271st/ 347
METRIC RANK
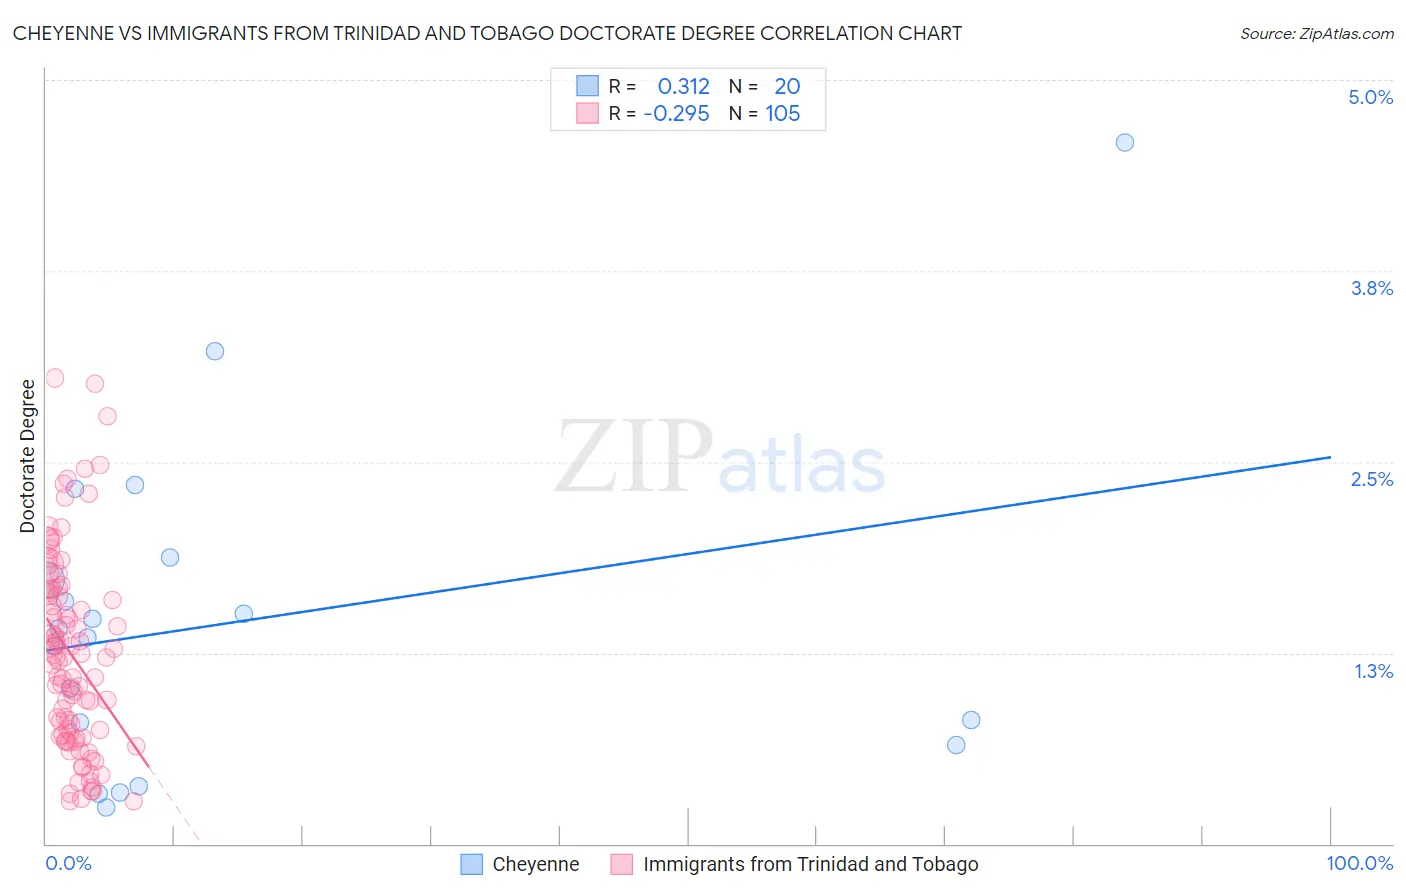
Cheyenne vs Immigrants from Trinidad and Tobago Doctorate Degree Correlation Chart
The statistical analysis conducted on geographies consisting of 80,230,104 people shows a mild positive correlation between the proportion of Cheyenne and percentage of population with at least doctorate degree education in the United States with a correlation coefficient (R) of 0.312 and weighted average of 1.6%. Similarly, the statistical analysis conducted on geographies consisting of 222,674,417 people shows a weak negative correlation between the proportion of Immigrants from Trinidad and Tobago and percentage of population with at least doctorate degree education in the United States with a correlation coefficient (R) of -0.295 and weighted average of 1.5%, a difference of 7.5%.
Doctorate Degree Correlation Summary
| Measurement | Cheyenne | Immigrants from Trinidad and Tobago |
| Minimum | 0.23% | 0.28% |
| Maximum | 4.6% | 3.0% |
| Range | 4.4% | 2.8% |
| Mean | 1.5% | 1.2% |
| Median | 1.4% | 1.2% |
| Interquartile 25% (IQ1) | 0.72% | 0.71% |
| Interquartile 75% (IQ3) | 1.8% | 1.6% |
| Interquartile Range (IQR) | 1.1% | 0.93% |
| Standard Deviation (Sample) | 1.1% | 0.63% |
| Standard Deviation (Population) | 1.0% | 0.63% |
Similar Demographics by Doctorate Degree
Demographics Similar to Cheyenne by Doctorate Degree
In terms of doctorate degree, the demographic groups most similar to Cheyenne are Immigrants from Panama (1.6%, a difference of 0.19%), Ottawa (1.6%, a difference of 0.21%), Native Hawaiian (1.6%, a difference of 0.34%), West Indian (1.6%, a difference of 0.38%), and Immigrants from Congo (1.6%, a difference of 0.48%).
| Demographics | Rating | Rank | Doctorate Degree |
| Hopi | 3.2 /100 | #234 | Tragic 1.6% |
| Cree | 3.0 /100 | #235 | Tragic 1.6% |
| Indonesians | 2.8 /100 | #236 | Tragic 1.6% |
| Iroquois | 2.7 /100 | #237 | Tragic 1.6% |
| Immigrants | Congo | 2.6 /100 | #238 | Tragic 1.6% |
| West Indians | 2.5 /100 | #239 | Tragic 1.6% |
| Immigrants | Panama | 2.4 /100 | #240 | Tragic 1.6% |
| Cheyenne | 2.3 /100 | #241 | Tragic 1.6% |
| Ottawa | 2.2 /100 | #242 | Tragic 1.6% |
| Native Hawaiians | 2.1 /100 | #243 | Tragic 1.6% |
| French American Indians | 2.0 /100 | #244 | Tragic 1.6% |
| Delaware | 1.9 /100 | #245 | Tragic 1.6% |
| Hmong | 1.8 /100 | #246 | Tragic 1.6% |
| Comanche | 1.8 /100 | #247 | Tragic 1.6% |
| Africans | 1.8 /100 | #248 | Tragic 1.6% |
Demographics Similar to Immigrants from Trinidad and Tobago by Doctorate Degree
In terms of doctorate degree, the demographic groups most similar to Immigrants from Trinidad and Tobago are Salvadoran (1.5%, a difference of 0.070%), Immigrants from Barbados (1.5%, a difference of 0.090%), Crow (1.5%, a difference of 0.10%), Kiowa (1.5%, a difference of 0.19%), and U.S. Virgin Islander (1.5%, a difference of 0.19%).
| Demographics | Rating | Rank | Doctorate Degree |
| Blackfeet | 0.7 /100 | #264 | Tragic 1.5% |
| Nicaraguans | 0.6 /100 | #265 | Tragic 1.5% |
| Immigrants | Liberia | 0.5 /100 | #266 | Tragic 1.5% |
| Kiowa | 0.5 /100 | #267 | Tragic 1.5% |
| U.S. Virgin Islanders | 0.5 /100 | #268 | Tragic 1.5% |
| Crow | 0.5 /100 | #269 | Tragic 1.5% |
| Salvadorans | 0.5 /100 | #270 | Tragic 1.5% |
| Immigrants | Trinidad and Tobago | 0.5 /100 | #271 | Tragic 1.5% |
| Immigrants | Barbados | 0.4 /100 | #272 | Tragic 1.5% |
| Sioux | 0.4 /100 | #273 | Tragic 1.5% |
| Yaqui | 0.4 /100 | #274 | Tragic 1.5% |
| Aleuts | 0.4 /100 | #275 | Tragic 1.5% |
| Paiute | 0.4 /100 | #276 | Tragic 1.5% |
| Bahamians | 0.4 /100 | #277 | Tragic 1.5% |
| Hawaiians | 0.4 /100 | #278 | Tragic 1.5% |