Thai vs Immigrants from Trinidad and Tobago Doctorate Degree
COMPARE
Thai
Immigrants from Trinidad and Tobago
Doctorate Degree
Doctorate Degree Comparison
Thais
Immigrants from Trinidad and Tobago
2.8%
DOCTORATE DEGREE
100.0/ 100
METRIC RATING
21st/ 347
METRIC RANK
1.5%
DOCTORATE DEGREE
0.5/ 100
METRIC RATING
271st/ 347
METRIC RANK
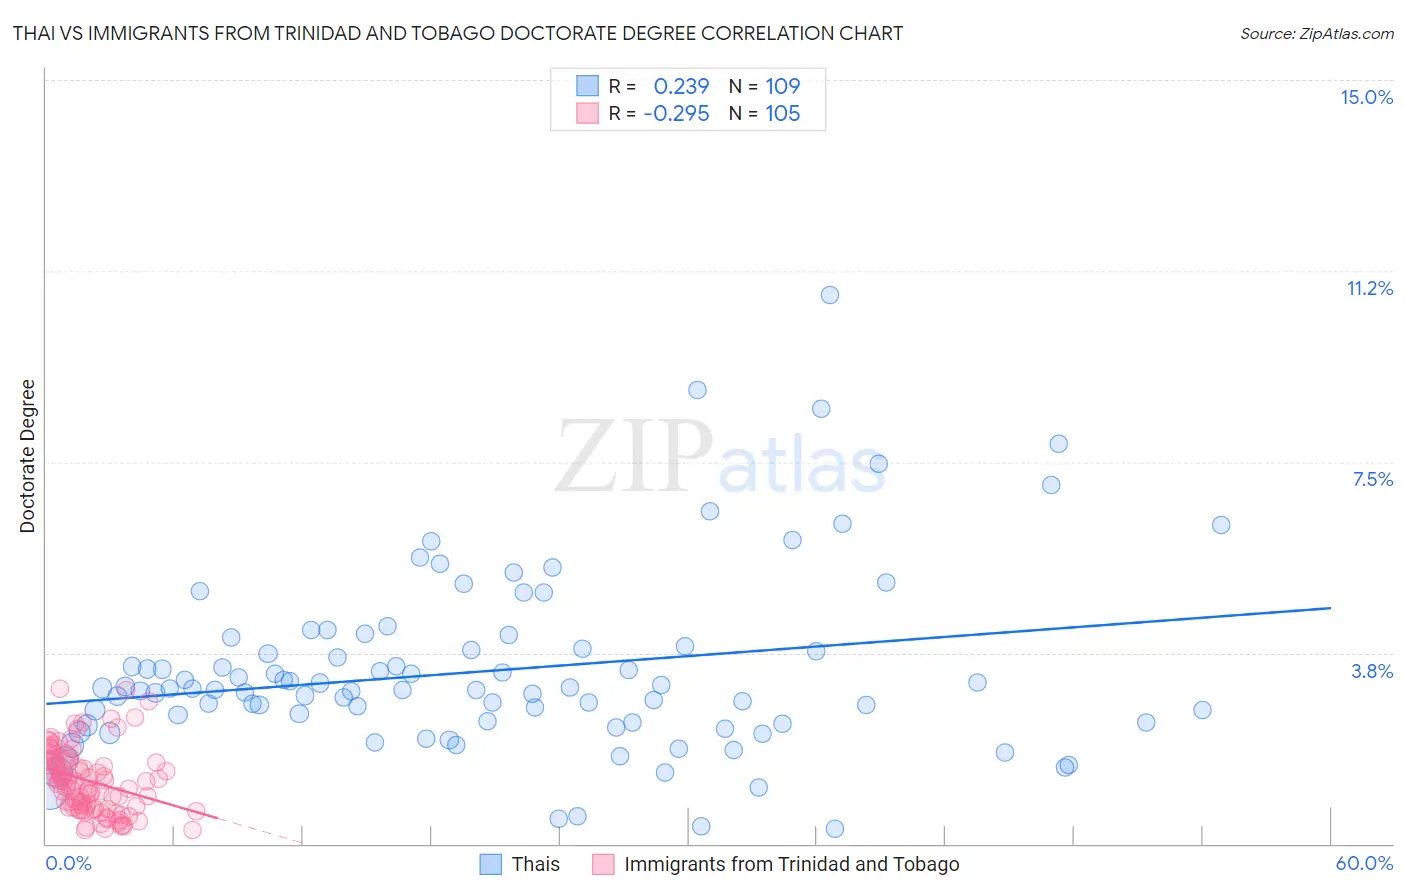
Thai vs Immigrants from Trinidad and Tobago Doctorate Degree Correlation Chart
The statistical analysis conducted on geographies consisting of 470,013,150 people shows a weak positive correlation between the proportion of Thais and percentage of population with at least doctorate degree education in the United States with a correlation coefficient (R) of 0.239 and weighted average of 2.8%. Similarly, the statistical analysis conducted on geographies consisting of 222,674,417 people shows a weak negative correlation between the proportion of Immigrants from Trinidad and Tobago and percentage of population with at least doctorate degree education in the United States with a correlation coefficient (R) of -0.295 and weighted average of 1.5%, a difference of 87.3%.
Doctorate Degree Correlation Summary
| Measurement | Thai | Immigrants from Trinidad and Tobago |
| Minimum | 0.30% | 0.28% |
| Maximum | 10.8% | 3.0% |
| Range | 10.5% | 2.8% |
| Mean | 3.4% | 1.2% |
| Median | 3.0% | 1.2% |
| Interquartile 25% (IQ1) | 2.4% | 0.71% |
| Interquartile 75% (IQ3) | 3.8% | 1.6% |
| Interquartile Range (IQR) | 1.5% | 0.93% |
| Standard Deviation (Sample) | 1.8% | 0.63% |
| Standard Deviation (Population) | 1.8% | 0.63% |
Similar Demographics by Doctorate Degree
Demographics Similar to Thais by Doctorate Degree
In terms of doctorate degree, the demographic groups most similar to Thais are Mongolian (2.8%, a difference of 0.20%), Immigrants from Denmark (2.8%, a difference of 0.33%), Immigrants from Hong Kong (2.8%, a difference of 0.35%), Immigrants from Japan (2.8%, a difference of 0.70%), and Immigrants from Sri Lanka (2.8%, a difference of 1.1%).
| Demographics | Rating | Rank | Doctorate Degree |
| Immigrants | France | 100.0 /100 | #14 | Exceptional 2.9% |
| Immigrants | India | 100.0 /100 | #15 | Exceptional 2.8% |
| Eastern Europeans | 100.0 /100 | #16 | Exceptional 2.8% |
| Immigrants | Australia | 100.0 /100 | #17 | Exceptional 2.8% |
| Immigrants | Sri Lanka | 100.0 /100 | #18 | Exceptional 2.8% |
| Immigrants | Japan | 100.0 /100 | #19 | Exceptional 2.8% |
| Immigrants | Hong Kong | 100.0 /100 | #20 | Exceptional 2.8% |
| Thais | 100.0 /100 | #21 | Exceptional 2.8% |
| Mongolians | 100.0 /100 | #22 | Exceptional 2.8% |
| Immigrants | Denmark | 100.0 /100 | #23 | Exceptional 2.8% |
| Israelis | 100.0 /100 | #24 | Exceptional 2.7% |
| Immigrants | Saudi Arabia | 100.0 /100 | #25 | Exceptional 2.7% |
| Turks | 100.0 /100 | #26 | Exceptional 2.7% |
| Immigrants | Turkey | 100.0 /100 | #27 | Exceptional 2.6% |
| Burmese | 100.0 /100 | #28 | Exceptional 2.6% |
Demographics Similar to Immigrants from Trinidad and Tobago by Doctorate Degree
In terms of doctorate degree, the demographic groups most similar to Immigrants from Trinidad and Tobago are Salvadoran (1.5%, a difference of 0.070%), Immigrants from Barbados (1.5%, a difference of 0.090%), Crow (1.5%, a difference of 0.10%), Kiowa (1.5%, a difference of 0.19%), and U.S. Virgin Islander (1.5%, a difference of 0.19%).
| Demographics | Rating | Rank | Doctorate Degree |
| Blackfeet | 0.7 /100 | #264 | Tragic 1.5% |
| Nicaraguans | 0.6 /100 | #265 | Tragic 1.5% |
| Immigrants | Liberia | 0.5 /100 | #266 | Tragic 1.5% |
| Kiowa | 0.5 /100 | #267 | Tragic 1.5% |
| U.S. Virgin Islanders | 0.5 /100 | #268 | Tragic 1.5% |
| Crow | 0.5 /100 | #269 | Tragic 1.5% |
| Salvadorans | 0.5 /100 | #270 | Tragic 1.5% |
| Immigrants | Trinidad and Tobago | 0.5 /100 | #271 | Tragic 1.5% |
| Immigrants | Barbados | 0.4 /100 | #272 | Tragic 1.5% |
| Sioux | 0.4 /100 | #273 | Tragic 1.5% |
| Yaqui | 0.4 /100 | #274 | Tragic 1.5% |
| Aleuts | 0.4 /100 | #275 | Tragic 1.5% |
| Paiute | 0.4 /100 | #276 | Tragic 1.5% |
| Bahamians | 0.4 /100 | #277 | Tragic 1.5% |
| Hawaiians | 0.4 /100 | #278 | Tragic 1.5% |