Fijian vs Immigrants from Latvia Doctorate Degree
COMPARE
Fijian
Immigrants from Latvia
Doctorate Degree
Doctorate Degree Comparison
Fijians
Immigrants from Latvia
1.1%
DOCTORATE DEGREE
0.0/ 100
METRIC RATING
343rd/ 347
METRIC RANK
2.4%
DOCTORATE DEGREE
100.0/ 100
METRIC RATING
53rd/ 347
METRIC RANK
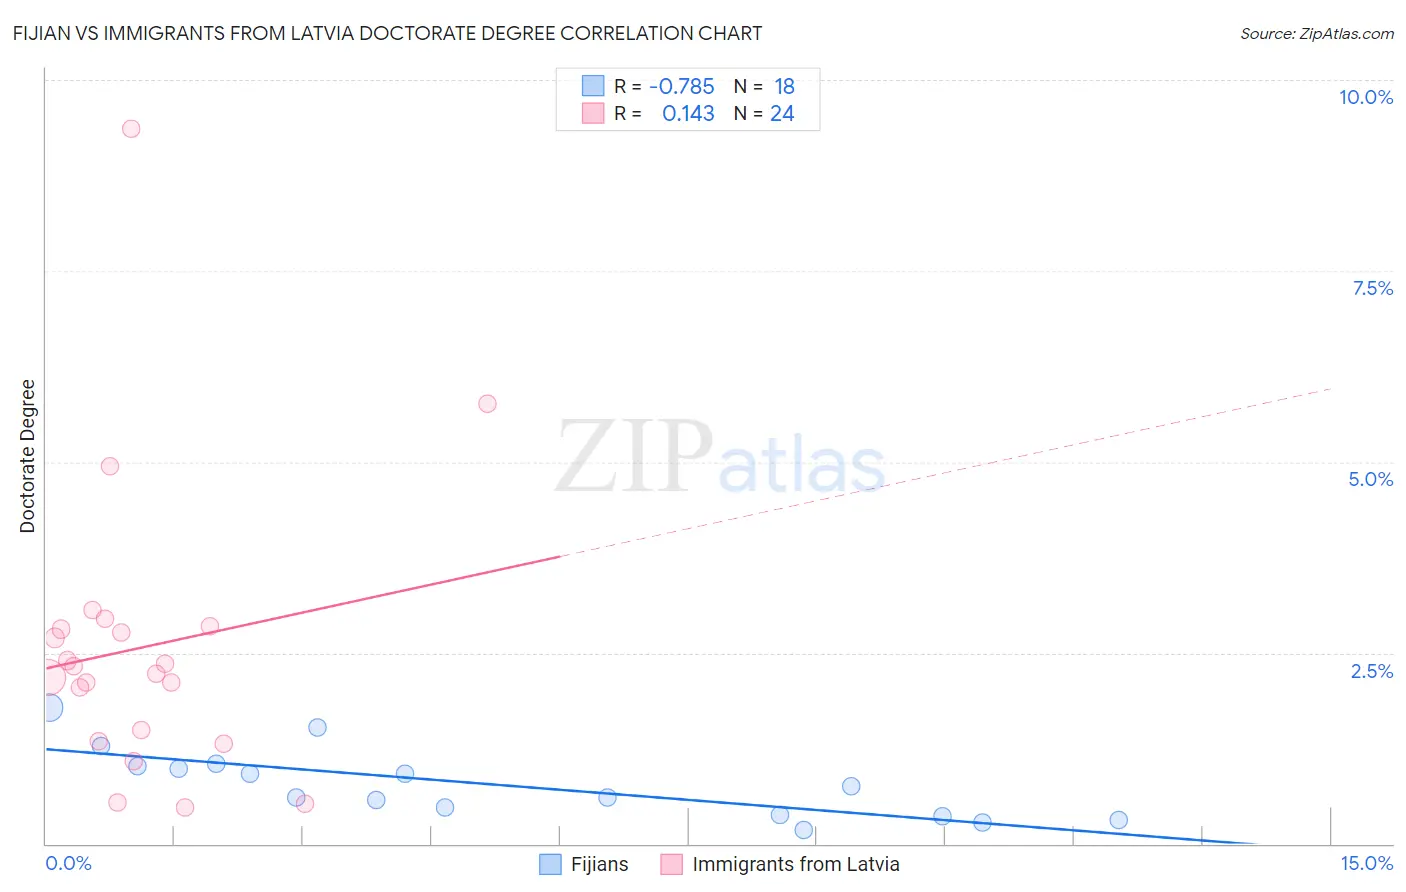
Fijian vs Immigrants from Latvia Doctorate Degree Correlation Chart
The statistical analysis conducted on geographies consisting of 55,685,158 people shows a strong negative correlation between the proportion of Fijians and percentage of population with at least doctorate degree education in the United States with a correlation coefficient (R) of -0.785 and weighted average of 1.1%. Similarly, the statistical analysis conducted on geographies consisting of 113,595,553 people shows a poor positive correlation between the proportion of Immigrants from Latvia and percentage of population with at least doctorate degree education in the United States with a correlation coefficient (R) of 0.143 and weighted average of 2.4%, a difference of 111.2%.
Doctorate Degree Correlation Summary
| Measurement | Fijian | Immigrants from Latvia |
| Minimum | 0.18% | 0.48% |
| Maximum | 1.8% | 9.4% |
| Range | 1.6% | 8.9% |
| Mean | 0.78% | 2.6% |
| Median | 0.68% | 2.3% |
| Interquartile 25% (IQ1) | 0.37% | 1.4% |
| Interquartile 75% (IQ3) | 1.0% | 2.8% |
| Interquartile Range (IQR) | 0.64% | 1.4% |
| Standard Deviation (Sample) | 0.45% | 1.9% |
| Standard Deviation (Population) | 0.43% | 1.9% |
Similar Demographics by Doctorate Degree
Demographics Similar to Fijians by Doctorate Degree
In terms of doctorate degree, the demographic groups most similar to Fijians are Immigrants from Mexico (1.1%, a difference of 2.1%), Arapaho (1.2%, a difference of 3.4%), Lumbee (1.1%, a difference of 3.6%), Mexican (1.2%, a difference of 3.8%), and Immigrants from Cuba (1.2%, a difference of 4.3%).
| Demographics | Rating | Rank | Doctorate Degree |
| Immigrants | Caribbean | 0.0 /100 | #333 | Tragic 1.3% |
| Immigrants | Dominican Republic | 0.0 /100 | #334 | Tragic 1.3% |
| Immigrants | Haiti | 0.0 /100 | #335 | Tragic 1.3% |
| Nepalese | 0.0 /100 | #336 | Tragic 1.3% |
| Bangladeshis | 0.0 /100 | #337 | Tragic 1.2% |
| Puget Sound Salish | 0.0 /100 | #338 | Tragic 1.2% |
| Immigrants | Central America | 0.0 /100 | #339 | Tragic 1.2% |
| Immigrants | Cuba | 0.0 /100 | #340 | Tragic 1.2% |
| Mexicans | 0.0 /100 | #341 | Tragic 1.2% |
| Arapaho | 0.0 /100 | #342 | Tragic 1.2% |
| Fijians | 0.0 /100 | #343 | Tragic 1.1% |
| Immigrants | Mexico | 0.0 /100 | #344 | Tragic 1.1% |
| Lumbee | 0.0 /100 | #345 | Tragic 1.1% |
| Spanish American Indians | 0.0 /100 | #346 | Tragic 1.1% |
| Houma | 0.0 /100 | #347 | Tragic 0.96% |
Demographics Similar to Immigrants from Latvia by Doctorate Degree
In terms of doctorate degree, the demographic groups most similar to Immigrants from Latvia are Bulgarian (2.4%, a difference of 0.12%), Australian (2.4%, a difference of 0.59%), Immigrants from Norway (2.4%, a difference of 0.68%), Immigrants from Indonesia (2.4%, a difference of 0.68%), and Bolivian (2.4%, a difference of 0.76%).
| Demographics | Rating | Rank | Doctorate Degree |
| Immigrants | Austria | 100.0 /100 | #46 | Exceptional 2.4% |
| Immigrants | Western Europe | 100.0 /100 | #47 | Exceptional 2.4% |
| Asians | 100.0 /100 | #48 | Exceptional 2.4% |
| Immigrants | Asia | 100.0 /100 | #49 | Exceptional 2.4% |
| Immigrants | Norway | 100.0 /100 | #50 | Exceptional 2.4% |
| Australians | 100.0 /100 | #51 | Exceptional 2.4% |
| Bulgarians | 100.0 /100 | #52 | Exceptional 2.4% |
| Immigrants | Latvia | 100.0 /100 | #53 | Exceptional 2.4% |
| Immigrants | Indonesia | 100.0 /100 | #54 | Exceptional 2.4% |
| Bolivians | 100.0 /100 | #55 | Exceptional 2.4% |
| Immigrants | Czechoslovakia | 100.0 /100 | #56 | Exceptional 2.4% |
| Immigrants | Ethiopia | 100.0 /100 | #57 | Exceptional 2.4% |
| Ethiopians | 99.9 /100 | #58 | Exceptional 2.3% |
| South Africans | 99.9 /100 | #59 | Exceptional 2.3% |
| Immigrants | Serbia | 99.9 /100 | #60 | Exceptional 2.3% |