Romanian vs Immigrants from Trinidad and Tobago Doctorate Degree
COMPARE
Romanian
Immigrants from Trinidad and Tobago
Doctorate Degree
Doctorate Degree Comparison
Romanians
Immigrants from Trinidad and Tobago
2.1%
DOCTORATE DEGREE
98.1/ 100
METRIC RATING
103rd/ 347
METRIC RANK
1.5%
DOCTORATE DEGREE
0.5/ 100
METRIC RATING
271st/ 347
METRIC RANK
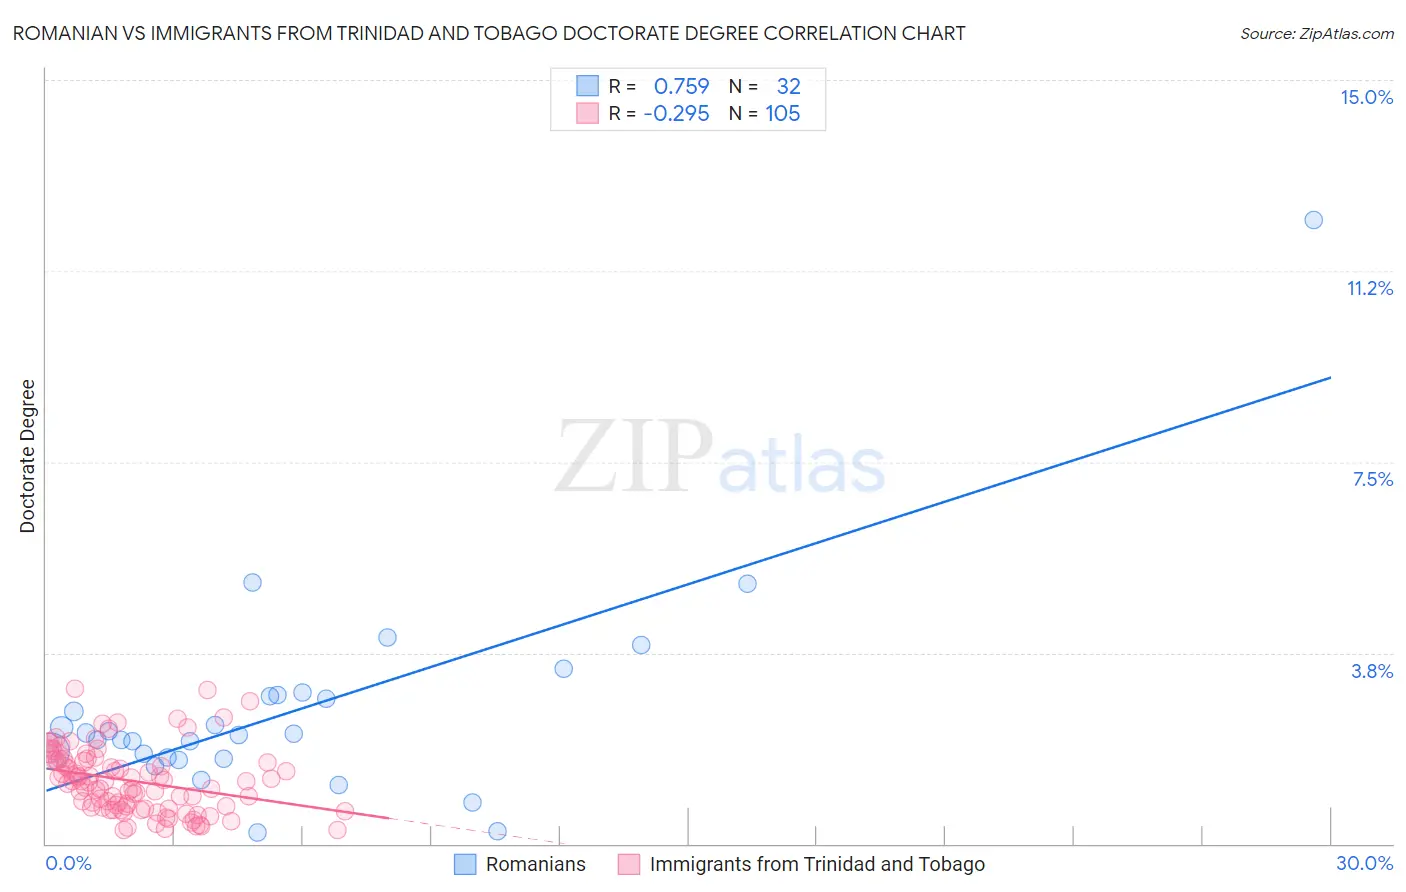
Romanian vs Immigrants from Trinidad and Tobago Doctorate Degree Correlation Chart
The statistical analysis conducted on geographies consisting of 374,979,448 people shows a strong positive correlation between the proportion of Romanians and percentage of population with at least doctorate degree education in the United States with a correlation coefficient (R) of 0.759 and weighted average of 2.1%. Similarly, the statistical analysis conducted on geographies consisting of 222,674,417 people shows a weak negative correlation between the proportion of Immigrants from Trinidad and Tobago and percentage of population with at least doctorate degree education in the United States with a correlation coefficient (R) of -0.295 and weighted average of 1.5%, a difference of 42.6%.
Doctorate Degree Correlation Summary
| Measurement | Romanian | Immigrants from Trinidad and Tobago |
| Minimum | 0.21% | 0.28% |
| Maximum | 12.2% | 3.0% |
| Range | 12.0% | 2.8% |
| Mean | 2.6% | 1.2% |
| Median | 2.1% | 1.2% |
| Interquartile 25% (IQ1) | 1.7% | 0.71% |
| Interquartile 75% (IQ3) | 2.9% | 1.6% |
| Interquartile Range (IQR) | 1.2% | 0.93% |
| Standard Deviation (Sample) | 2.1% | 0.63% |
| Standard Deviation (Population) | 2.1% | 0.63% |
Similar Demographics by Doctorate Degree
Demographics Similar to Romanians by Doctorate Degree
In terms of doctorate degree, the demographic groups most similar to Romanians are Immigrants from Chile (2.1%, a difference of 0.010%), Austrian (2.1%, a difference of 0.12%), Immigrants from Eastern Africa (2.1%, a difference of 0.23%), Immigrants from Eastern Europe (2.1%, a difference of 0.26%), and Immigrants from Egypt (2.1%, a difference of 0.27%).
| Demographics | Rating | Rank | Doctorate Degree |
| Immigrants | Northern Africa | 98.4 /100 | #96 | Exceptional 2.1% |
| Immigrants | Eritrea | 98.4 /100 | #97 | Exceptional 2.1% |
| Armenians | 98.3 /100 | #98 | Exceptional 2.1% |
| Immigrants | Egypt | 98.2 /100 | #99 | Exceptional 2.1% |
| Immigrants | Eastern Europe | 98.2 /100 | #100 | Exceptional 2.1% |
| Immigrants | Eastern Africa | 98.2 /100 | #101 | Exceptional 2.1% |
| Immigrants | Chile | 98.1 /100 | #102 | Exceptional 2.1% |
| Romanians | 98.1 /100 | #103 | Exceptional 2.1% |
| Austrians | 98.0 /100 | #104 | Exceptional 2.1% |
| Arabs | 97.8 /100 | #105 | Exceptional 2.1% |
| Sudanese | 97.7 /100 | #106 | Exceptional 2.1% |
| Europeans | 97.5 /100 | #107 | Exceptional 2.1% |
| Immigrants | Germany | 97.3 /100 | #108 | Exceptional 2.1% |
| Ukrainians | 97.2 /100 | #109 | Exceptional 2.1% |
| Brazilians | 97.2 /100 | #110 | Exceptional 2.1% |
Demographics Similar to Immigrants from Trinidad and Tobago by Doctorate Degree
In terms of doctorate degree, the demographic groups most similar to Immigrants from Trinidad and Tobago are Salvadoran (1.5%, a difference of 0.070%), Immigrants from Barbados (1.5%, a difference of 0.090%), Crow (1.5%, a difference of 0.10%), Kiowa (1.5%, a difference of 0.19%), and U.S. Virgin Islander (1.5%, a difference of 0.19%).
| Demographics | Rating | Rank | Doctorate Degree |
| Blackfeet | 0.7 /100 | #264 | Tragic 1.5% |
| Nicaraguans | 0.6 /100 | #265 | Tragic 1.5% |
| Immigrants | Liberia | 0.5 /100 | #266 | Tragic 1.5% |
| Kiowa | 0.5 /100 | #267 | Tragic 1.5% |
| U.S. Virgin Islanders | 0.5 /100 | #268 | Tragic 1.5% |
| Crow | 0.5 /100 | #269 | Tragic 1.5% |
| Salvadorans | 0.5 /100 | #270 | Tragic 1.5% |
| Immigrants | Trinidad and Tobago | 0.5 /100 | #271 | Tragic 1.5% |
| Immigrants | Barbados | 0.4 /100 | #272 | Tragic 1.5% |
| Sioux | 0.4 /100 | #273 | Tragic 1.5% |
| Yaqui | 0.4 /100 | #274 | Tragic 1.5% |
| Aleuts | 0.4 /100 | #275 | Tragic 1.5% |
| Paiute | 0.4 /100 | #276 | Tragic 1.5% |
| Bahamians | 0.4 /100 | #277 | Tragic 1.5% |
| Hawaiians | 0.4 /100 | #278 | Tragic 1.5% |