Fijian vs Immigrants from Trinidad and Tobago In Labor Force | Age 45-54
COMPARE
Fijian
Immigrants from Trinidad and Tobago
In Labor Force | Age 45-54
In Labor Force | Age 45-54 Comparison
Fijians
Immigrants from Trinidad and Tobago
80.2%
IN LABOR FORCE | AGE 45-54
0.0/ 100
METRIC RATING
300th/ 347
METRIC RANK
82.0%
IN LABOR FORCE | AGE 45-54
1.2/ 100
METRIC RATING
237th/ 347
METRIC RANK
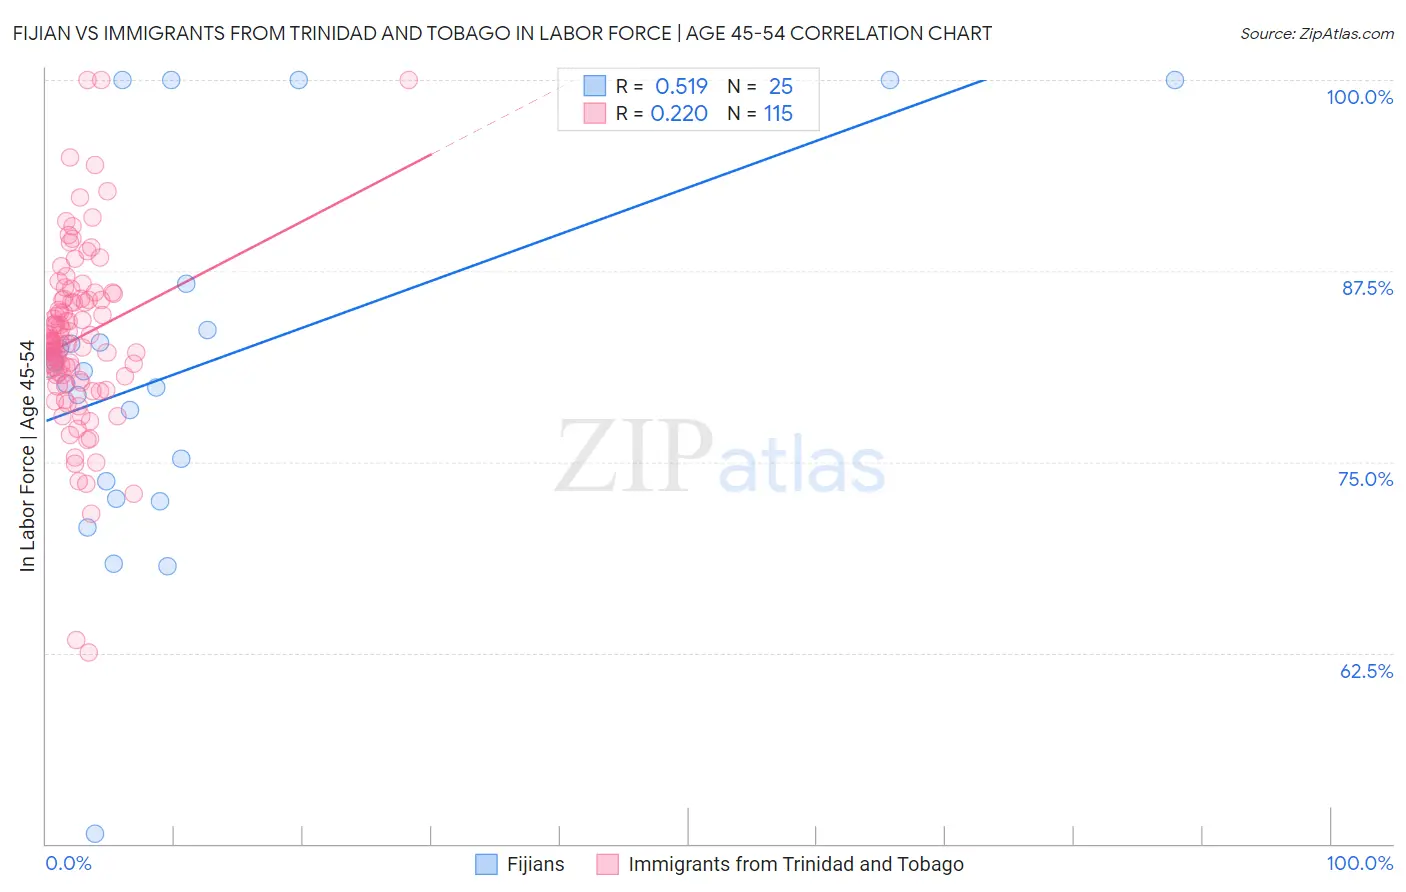
Fijian vs Immigrants from Trinidad and Tobago In Labor Force | Age 45-54 Correlation Chart
The statistical analysis conducted on geographies consisting of 55,946,141 people shows a substantial positive correlation between the proportion of Fijians and labor force participation rate among population between the ages 45 and 54 in the United States with a correlation coefficient (R) of 0.519 and weighted average of 80.2%. Similarly, the statistical analysis conducted on geographies consisting of 223,484,344 people shows a weak positive correlation between the proportion of Immigrants from Trinidad and Tobago and labor force participation rate among population between the ages 45 and 54 in the United States with a correlation coefficient (R) of 0.220 and weighted average of 82.0%, a difference of 2.1%.
In Labor Force | Age 45-54 Correlation Summary
| Measurement | Fijian | Immigrants from Trinidad and Tobago |
| Minimum | 50.7% | 62.5% |
| Maximum | 100.0% | 100.0% |
| Range | 49.3% | 37.5% |
| Mean | 81.3% | 83.1% |
| Median | 80.9% | 82.8% |
| Interquartile 25% (IQ1) | 73.2% | 80.6% |
| Interquartile 75% (IQ3) | 85.2% | 85.6% |
| Interquartile Range (IQR) | 12.0% | 5.0% |
| Standard Deviation (Sample) | 12.0% | 5.8% |
| Standard Deviation (Population) | 11.7% | 5.8% |
Similar Demographics by In Labor Force | Age 45-54
Demographics Similar to Fijians by In Labor Force | Age 45-54
In terms of in labor force | age 45-54, the demographic groups most similar to Fijians are Dominican (80.3%, a difference of 0.0%), Spanish American Indian (80.2%, a difference of 0.010%), Immigrants from Central America (80.2%, a difference of 0.090%), Marshallese (80.3%, a difference of 0.11%), and American (80.4%, a difference of 0.15%).
| Demographics | Rating | Rank | In Labor Force | Age 45-54 |
| Osage | 0.0 /100 | #293 | Tragic 80.6% |
| Yakama | 0.0 /100 | #294 | Tragic 80.6% |
| Nepalese | 0.0 /100 | #295 | Tragic 80.5% |
| Africans | 0.0 /100 | #296 | Tragic 80.5% |
| Americans | 0.0 /100 | #297 | Tragic 80.4% |
| Marshallese | 0.0 /100 | #298 | Tragic 80.3% |
| Dominicans | 0.0 /100 | #299 | Tragic 80.3% |
| Fijians | 0.0 /100 | #300 | Tragic 80.2% |
| Spanish American Indians | 0.0 /100 | #301 | Tragic 80.2% |
| Immigrants | Central America | 0.0 /100 | #302 | Tragic 80.2% |
| Immigrants | Azores | 0.0 /100 | #303 | Tragic 80.1% |
| Hispanics or Latinos | 0.0 /100 | #304 | Tragic 80.1% |
| Immigrants | Dominican Republic | 0.0 /100 | #305 | Tragic 80.1% |
| Spanish Americans | 0.0 /100 | #306 | Tragic 80.1% |
| Blackfeet | 0.0 /100 | #307 | Tragic 80.0% |
Demographics Similar to Immigrants from Trinidad and Tobago by In Labor Force | Age 45-54
In terms of in labor force | age 45-54, the demographic groups most similar to Immigrants from Trinidad and Tobago are Subsaharan African (82.0%, a difference of 0.010%), Basque (82.0%, a difference of 0.010%), Trinidadian and Tobagonian (81.9%, a difference of 0.010%), Immigrants from Thailand (81.9%, a difference of 0.030%), and Immigrants from El Salvador (81.9%, a difference of 0.040%).
| Demographics | Rating | Rank | In Labor Force | Age 45-54 |
| Jamaicans | 1.8 /100 | #230 | Tragic 82.0% |
| Immigrants | Senegal | 1.7 /100 | #231 | Tragic 82.0% |
| Immigrants | Portugal | 1.7 /100 | #232 | Tragic 82.0% |
| Malaysians | 1.7 /100 | #233 | Tragic 82.0% |
| Salvadorans | 1.7 /100 | #234 | Tragic 82.0% |
| Sub-Saharan Africans | 1.2 /100 | #235 | Tragic 82.0% |
| Basques | 1.2 /100 | #236 | Tragic 82.0% |
| Immigrants | Trinidad and Tobago | 1.2 /100 | #237 | Tragic 82.0% |
| Trinidadians and Tobagonians | 1.1 /100 | #238 | Tragic 81.9% |
| Immigrants | Thailand | 1.0 /100 | #239 | Tragic 81.9% |
| Immigrants | El Salvador | 1.0 /100 | #240 | Tragic 81.9% |
| Immigrants | Cambodia | 0.8 /100 | #241 | Tragic 81.9% |
| Whites/Caucasians | 0.7 /100 | #242 | Tragic 81.9% |
| Samoans | 0.6 /100 | #243 | Tragic 81.8% |
| Celtics | 0.4 /100 | #244 | Tragic 81.8% |